
XII.C. Mol* Mutagenesis
Didem Vardar-Ulu and Keith Johnson
Overview: This activity demonstrates how to simulate a protein mutation by altering an amino acid in a polypeptide sequence
Outcome: The user will be able to change the identity of an amino acid residue in order to visualize the impact of mutagenesis on the protein of interest.
Time to complete: 15 minutes
Modeling Skills
- Changing the identity of an amino acid residue using AlphaFold
- Visualizing the impact of mutagenesis in the active site of the protein
About the Models
PDB ID: 4ltv
Protein: Epi-isozizaene synthase (EIZS)
Activity: Cyclizes the isoprenoid precursor, farnesyl diphosphate (FPP) to form the tricyclic terpene epi-isozizaene. Epi-isozizaene is an intermediate in the biosynthesis of the natural product albaflavenoid.
Description: Single chain, no ligands bound in the active site, two sulfate ions
Steps
Creating a Mutant Structure with Alphafold:
- Go to rcsb.org
- In the search bar at the top, type 4LTV and press Enter.
- On the landing page, click the “Structure” tab next to the highlighted “Structure Summary” tab (Figure 1, Arrow 1) to open the user interface and load the structure.
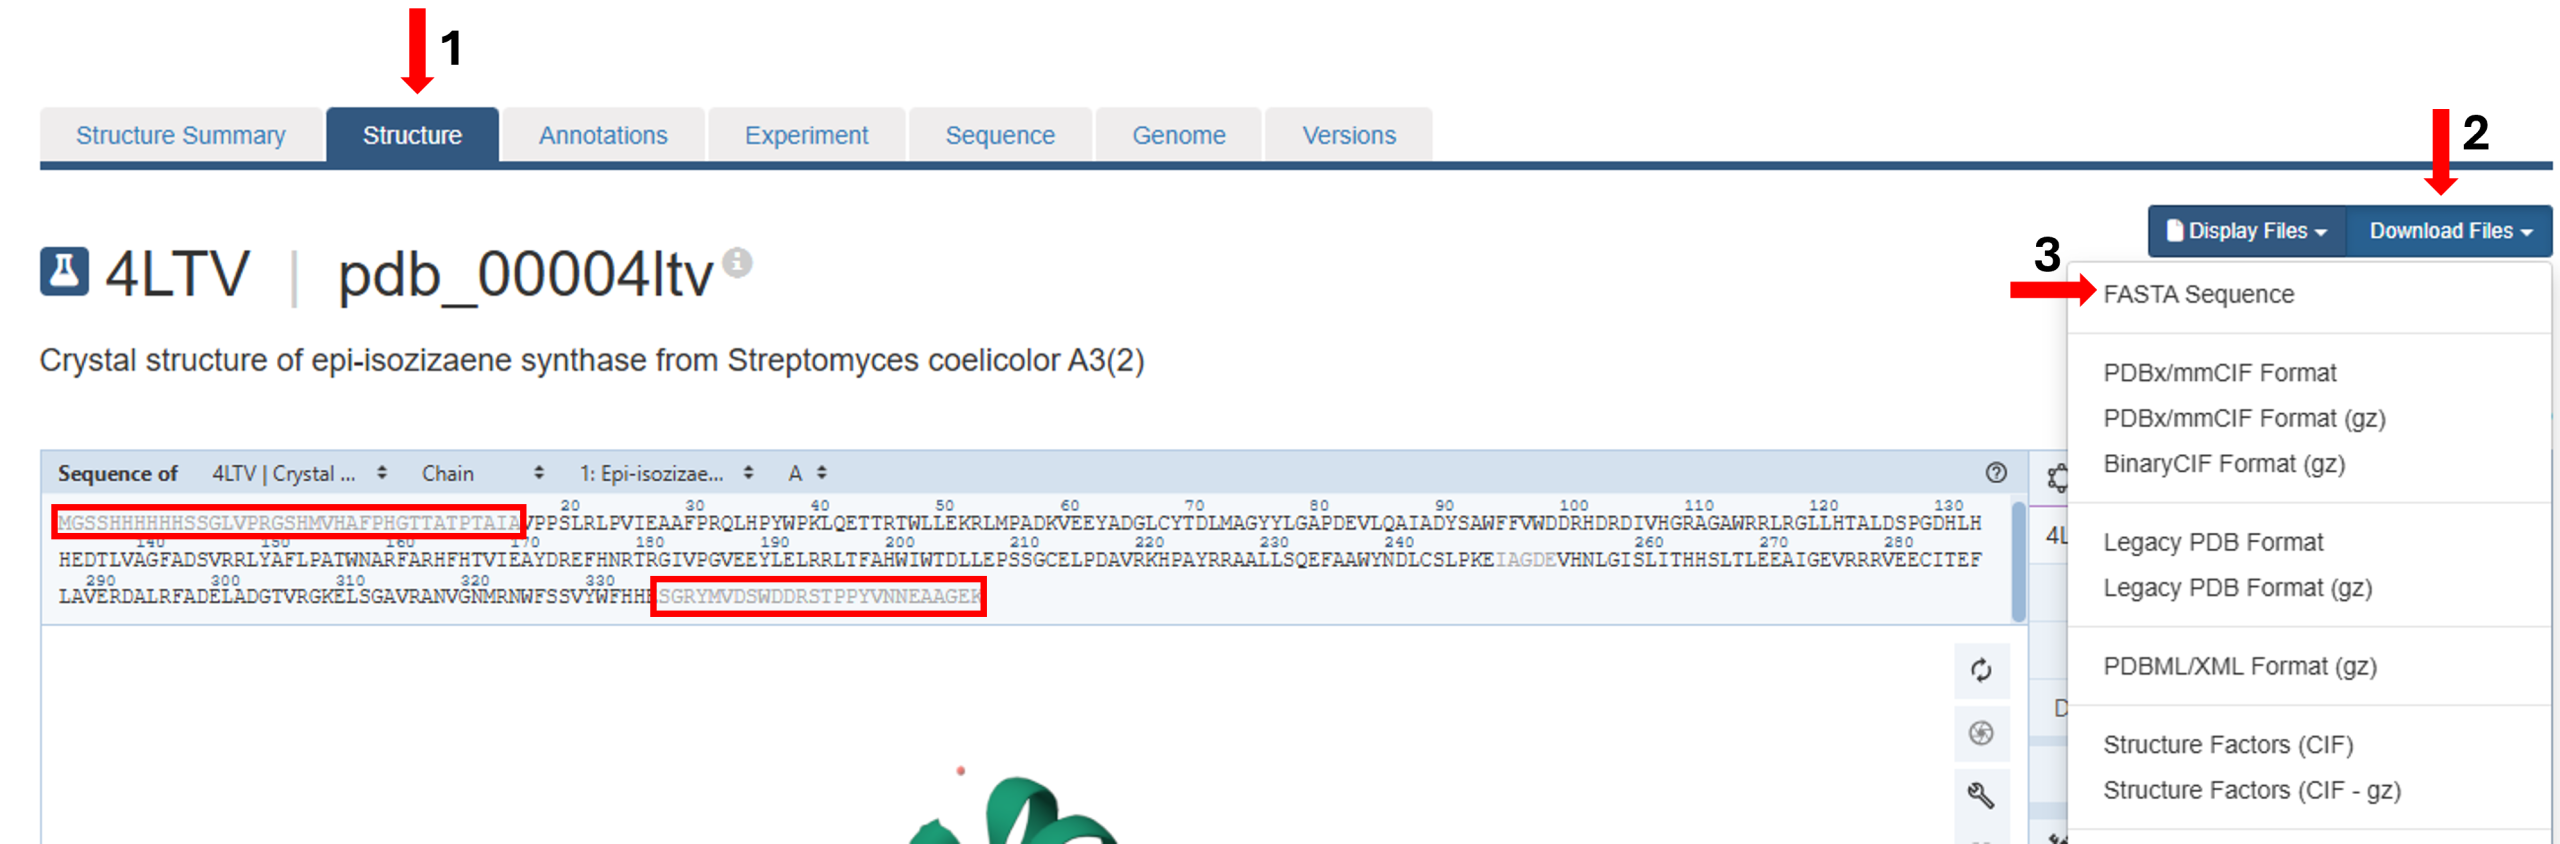
Figure 1: Accessing and downloading FASTA sequence of a PDB structure from Mol*. - Click the “Download Files” tab on the right (Figure 1, Arrow 2) to open the user interface and select “FASTA Sequence” (Figure 1, Arrow 3).
- Save the downloaded file to your computer.
- Open the Fasta sequence file in a program that will open text files (e.g., Microsoft Word, Text)
- Review the sequence displayed above the loaded structure on the 3D canvas to identify any residues from the FASTA sequence that are not part of the displayed 3D structure. These residues are shown in gray (red rectangles).
- Remove these residues from the mutant protein sequence to obtain the final mutant protein sequence you will use for 3D structure prediction.
- Locate the WFFVW sequence.
- Edit the sequence to change the second “F” to “A” and obtain the mutant protein sequence.
The second F in this sequence corresponds to F96 described in the mutagenesis experiments. - To predict the structure, go to the AlphaFold server.
Note: You may need to create a free account to access this content.
.
- Copy the final mutant protein sequence from step 9 and paste it into the sequence input box on the server (Figure 2, red box).
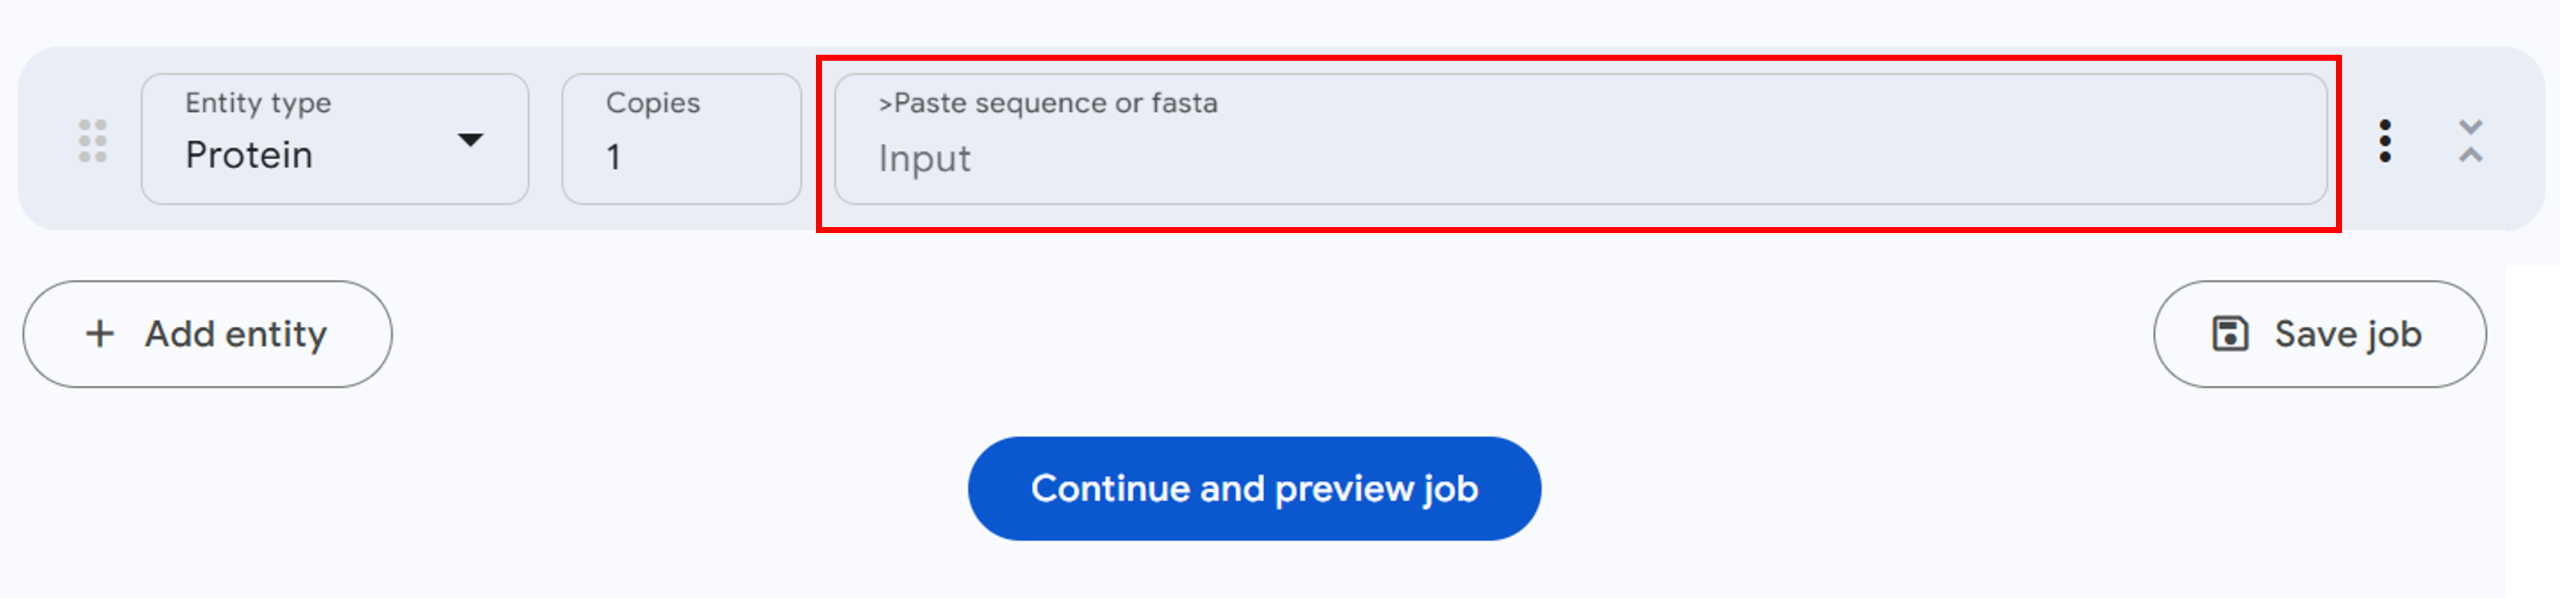
Figure 2: Sequence input panel for structure prediction in the AlphaFold server. - Scroll down and select ‘Continue and preview job’ (Figure 2, blue button).
- Enter a name for your job (E.g., Mutated EISZ) in the next window (Figure 3, Arrow 1) and click “Confirm and submit job” (Figure 3, blue button).
Note: You will see your job listed in the server window, accompanied by a rotating circle to the left of the job title, until the prediction is completed. It may take some time for AlphaFold to complete the prediction. Once the job completes, you will see a circle with a checkbox in the middle (Figure 3, red box).
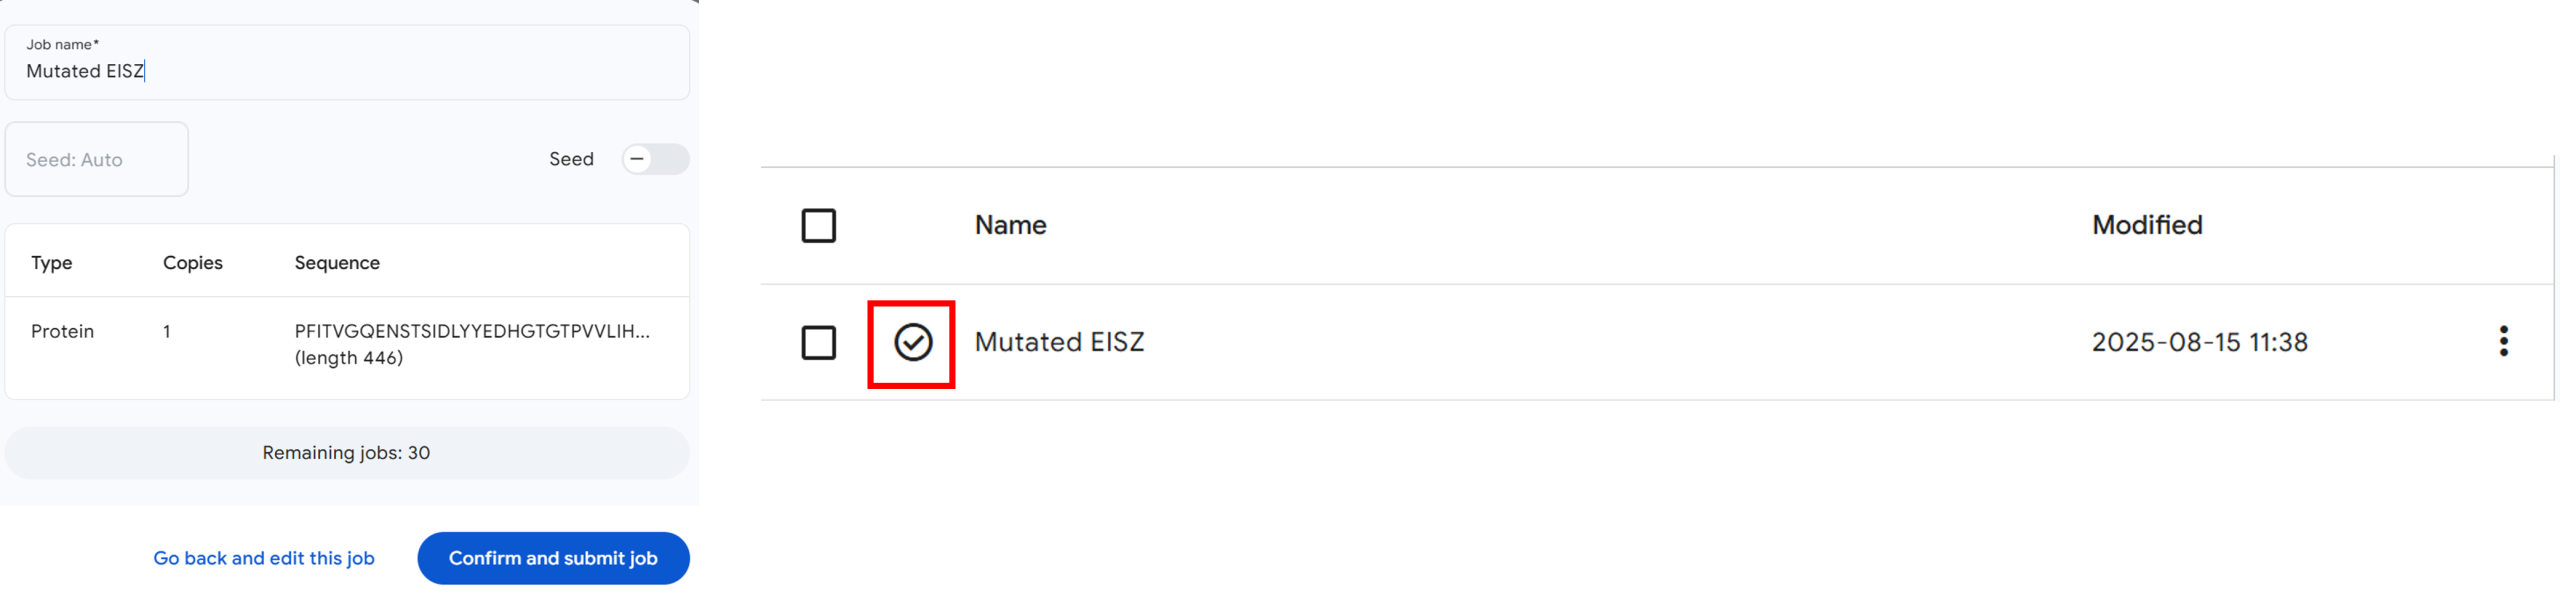
Figure 3: Submitting a predication job in the AlphaFold server and downloading predicted structures. - Click on the three dots next to the time and download the structure as a .zip folder (Figure 3, Arrow 2).
- Save the folder on your computer and extract the files to a new folder.
Note: AlphaFold generates multiple models of your structure, labeling them 0-4 with a .cif extension. These provide the structural coordinates for visualization and analysis. The folder also contains .json files that offer comprehensive data about the prediction’s confidence and input parameters. The model with the zero label is the structure with the highest confidence parameter.
- Go to https://www.rcsb.org/3d-view/ to access an expanded Mol* viewer with an “Import” Panel at the top of the Control Panel.
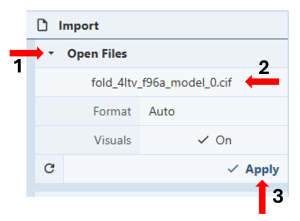
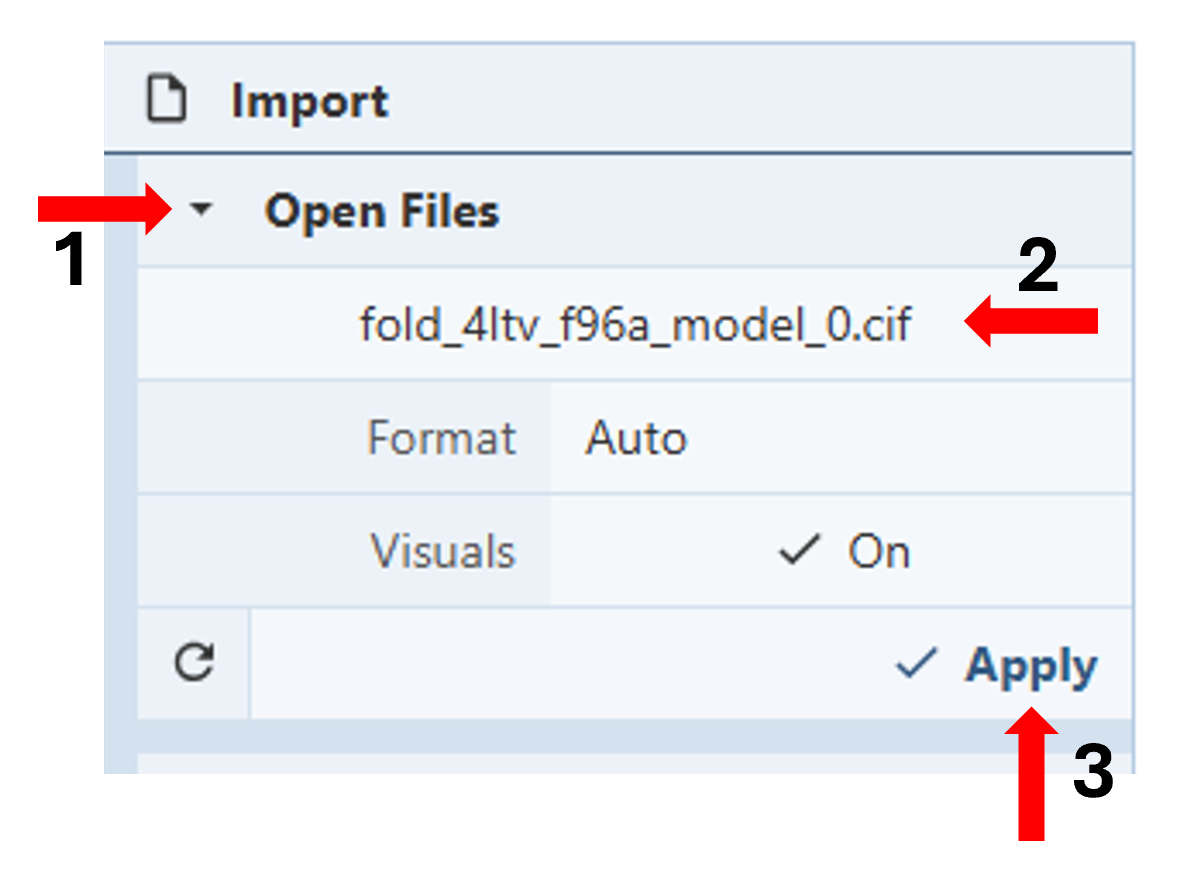
Figure 4: Loading the predicted structure into Mol*. - To load the predicted structure, you can either drag the .cif file onto the 3D canvas or click on “Open Files” (Figure 4, Arrow 1), select your file from your computer (Figure 4, Arrow 2), and then click “Apply” (Figure 4, Arrow 3).
Superpostion of the wildtype and the predicted protein structure after amino acid substitution:
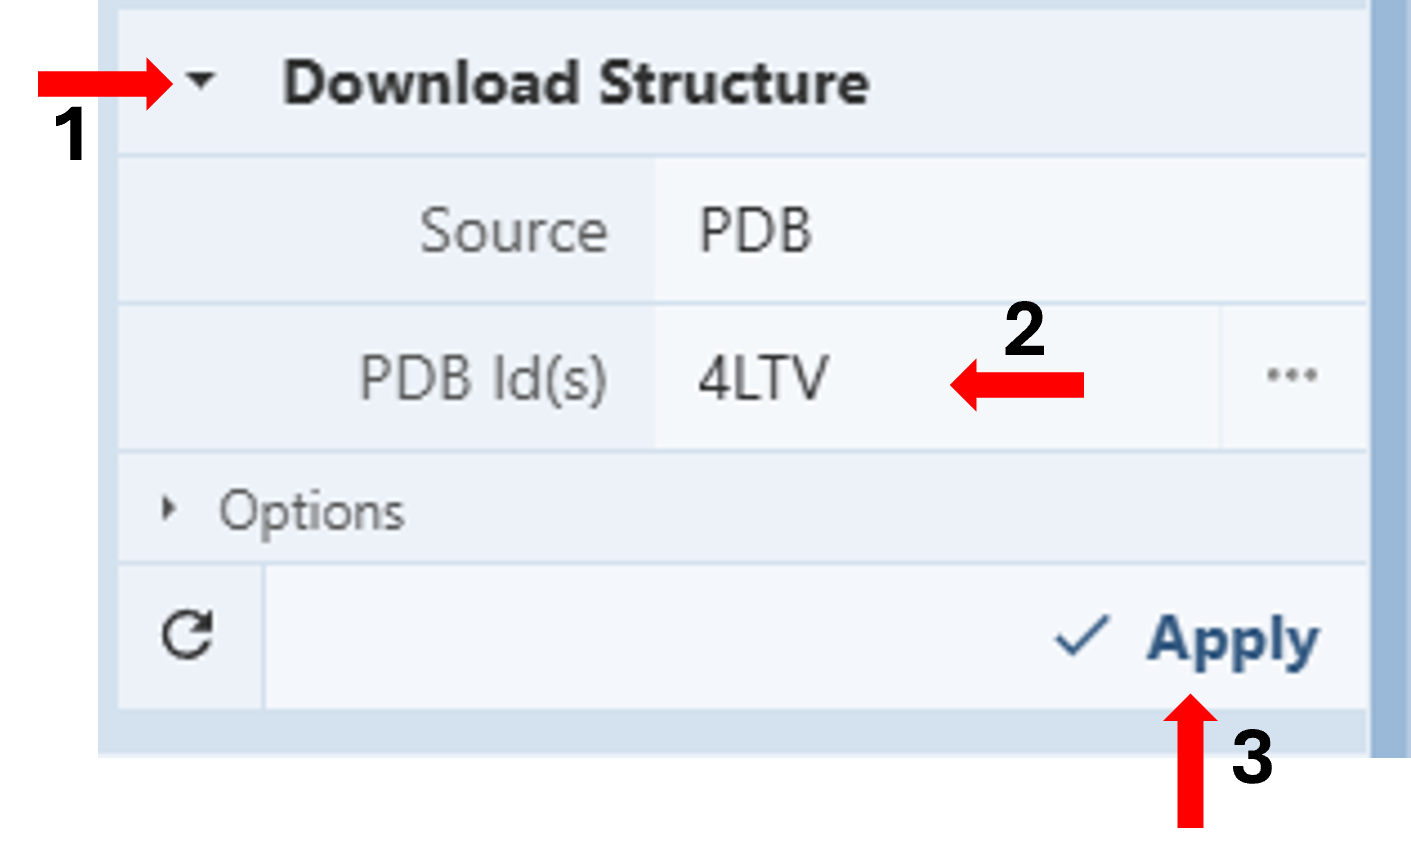
- In the Import window used above, go to “Download Structure”. (Figure 5, Arrow 1)
- Type the PDB IDs for the wildtype structure (4LTV) in the cell next to PDB ID(s) under “Download Structures” in the Import Panel. (Figure 5, Arrow 2)
- Click “Apply” (Figure 5, Arrow 3) to display the structure on the 3D canvas.
- Activate the “Select Mode Toggle” by clicking the “cursor” icon. (Figure 6, Arrow 1).
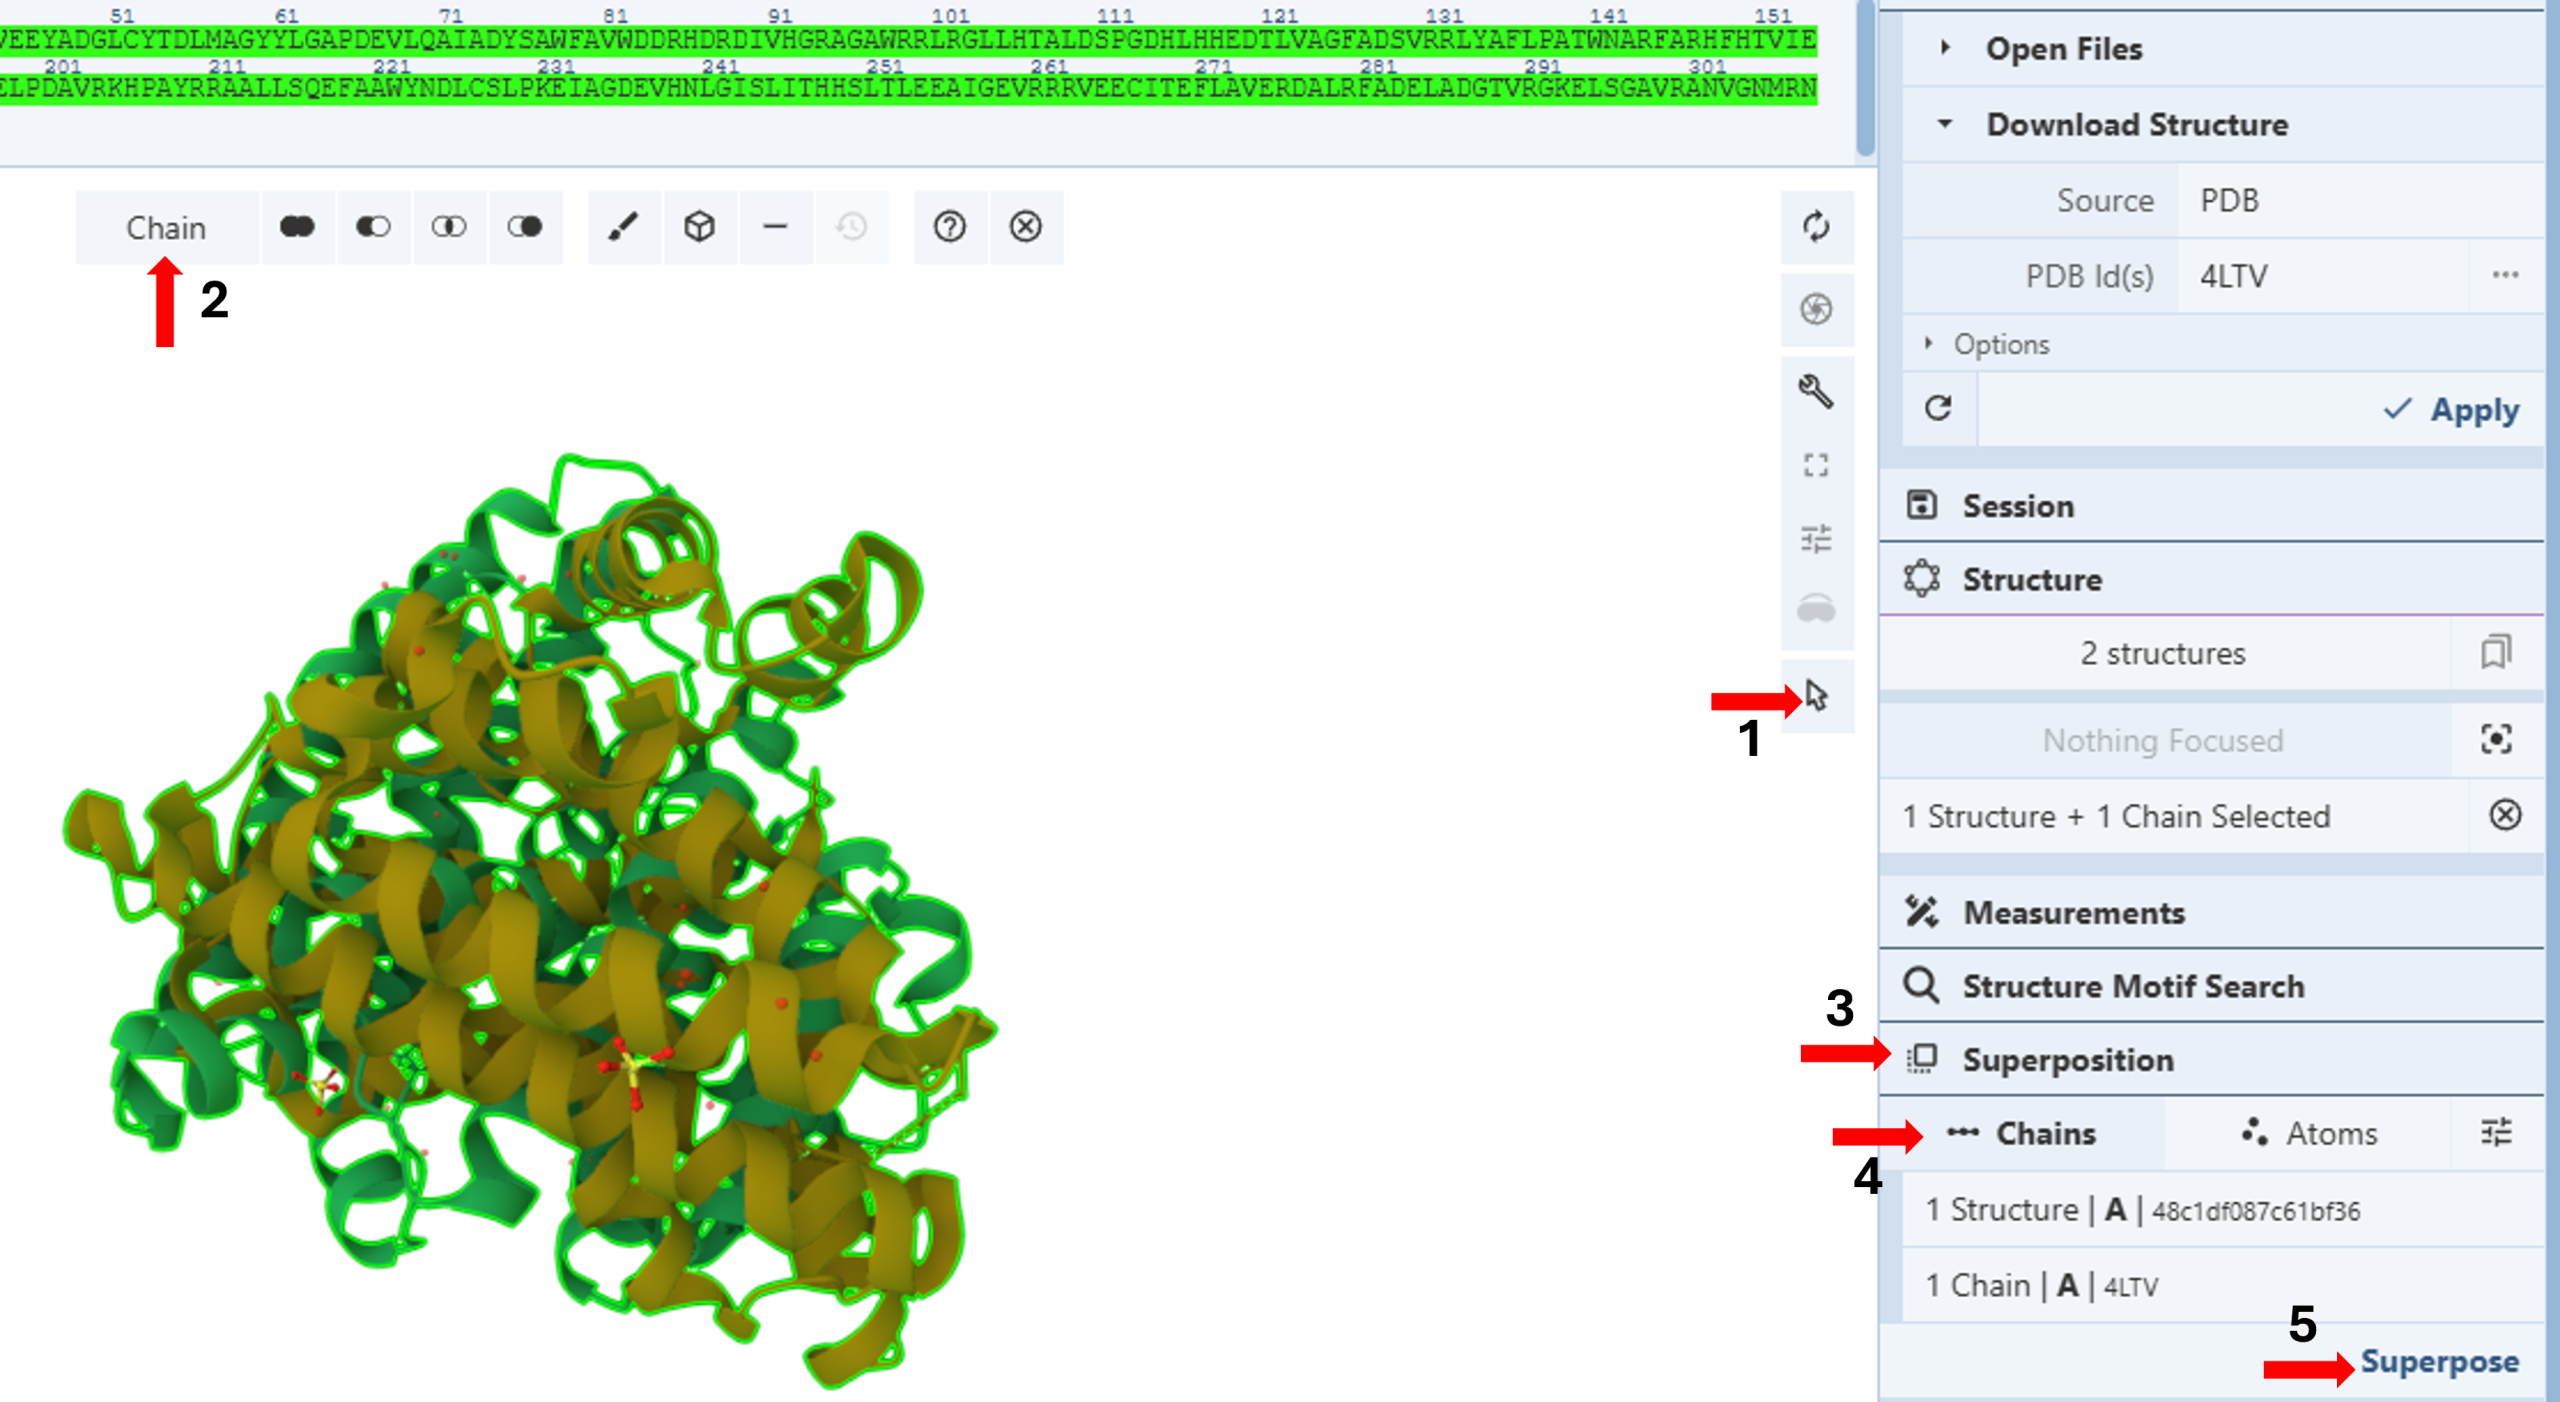
Figure 6: Superposing the wildtype and mutated structures by chain. - Choose your picking level as “Chain”. (Figure 6, Arrow 2)
- Click the “Superposition” tab (Figure 6, Arrow 3) to expand the menu.
- Click “Chains” (Figure 6, Arrow 4)
- Click each chain on the 3D canvas to select it.
Note: You will see a green highlight around the selected chain, and the selection will be noted in the “Superposition Panel” under “Chains”.
- Click “Superpose” (Figure 6, Arrow 5).
- Hide “Water” and “Ion” components from the original polymer by clicking on the corresponding eye icons in the components menu.
- Change the picking level to “Residue” (Figure 6, Arrow 2).
- Click on an empty space on the 3D canvas to reset any selection.
Creating a New Component for F96 and the substituted alanine residue, F96A, in the predicted structure:
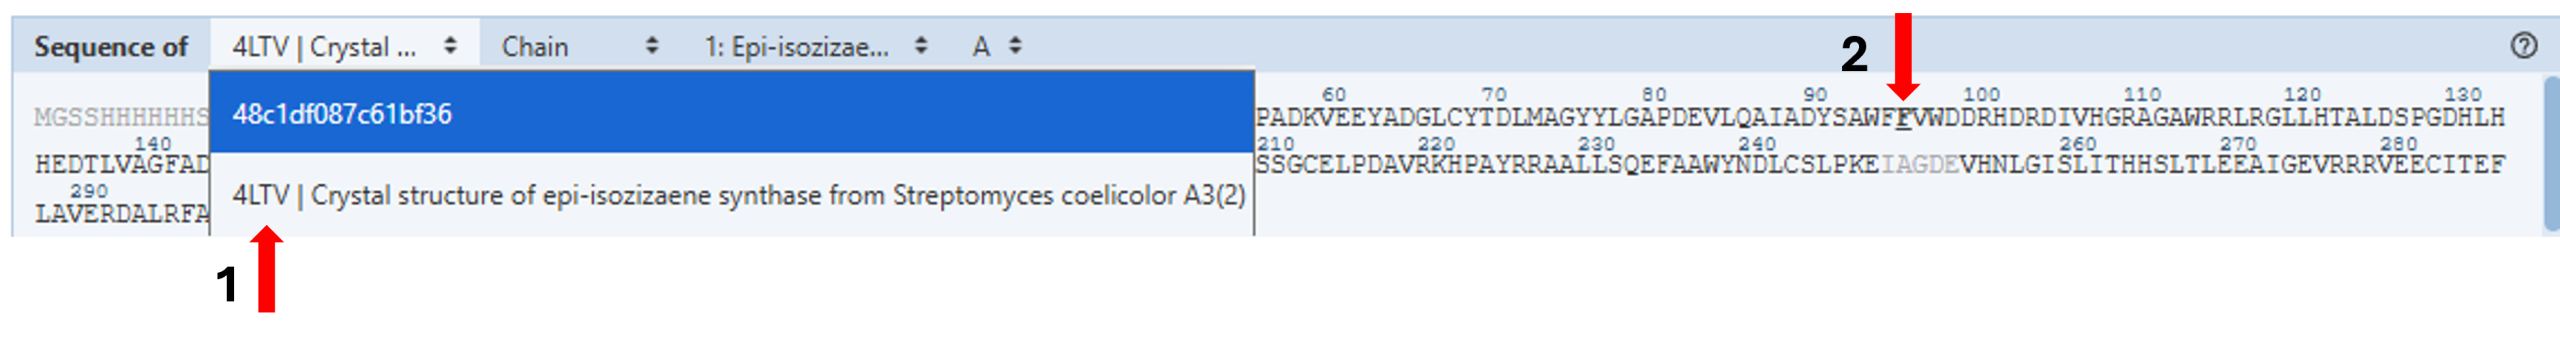
- Select the 4LTV sequence from the sequence panel. (Figure 7, Arrow 1).
- Select F96 from the displayed sequence on the sequence panel for the wildtype protein (Figure 7, Arrow 2).
Note: You can confirm which amino acid you are selecting by looking in the bottom-right corner of the image window.
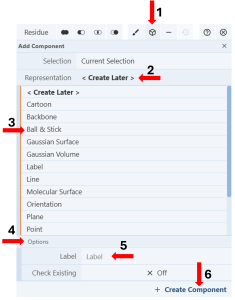
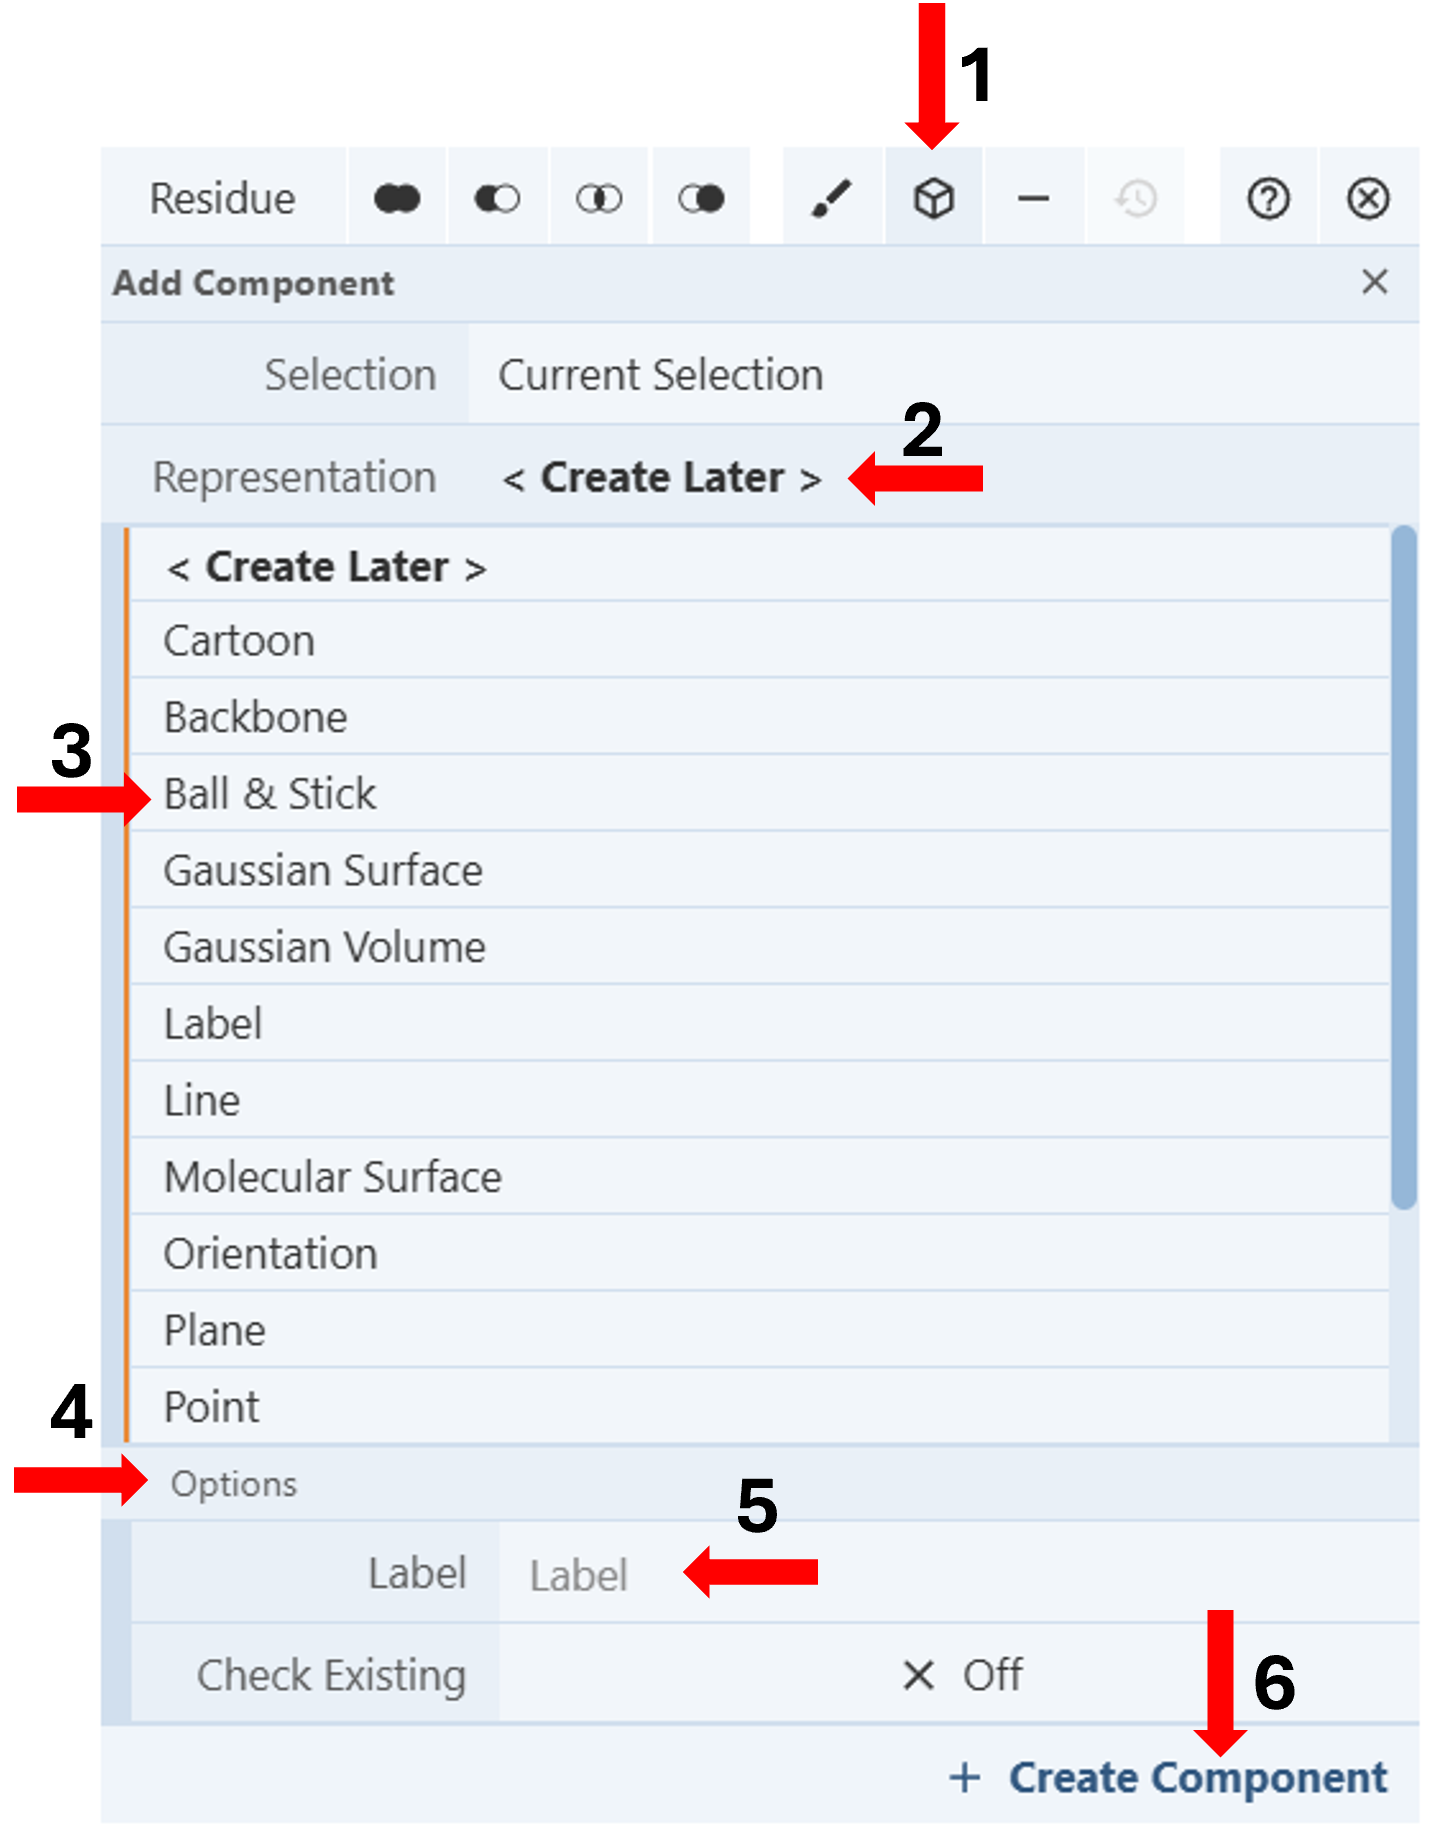
Figure 8: Creating a new component from a selection. - Click the “Components Icon” to activate a dropdown menu. (Figure 8, Arrow 1)
- Click the cell next to “Representation” (default “Create Later”) (Figure 8, Arrow 2) and choose your desired representation (E.g., Ball & Stick) (Figure 8, Arrow 3).
- Activate the “Options” by clicking on it (Figure 8, Arrow 4).
- Enter the desired label (E.g., F96) (Figure 8, Arrow 5).
- Click “Create Component” (Figure 8, Arrow 6).
- Change the displayed sequence on the sequence panel to the mutated structure by clicking on the tab next to “Sequence of” (Figure 7, Arrow 3) and then selecting the mutated sequence.
- Select the substituted alanine residue.
Note: The residue number for this residue has changed since the N-terminus of the original sequence was removed for Alphafold prediction (step 9 of Creating a Mutant Structure with Alphafold)
- Repeat steps 3-7, naming the new component F96A.
- Toggle the “Selection Mode” off by clicking the selection tool icon (Figure 7, Arrow 1).
Visualizing the change in the active site pocket due to mutagenesis:
Comparing volume occupied by side chains:
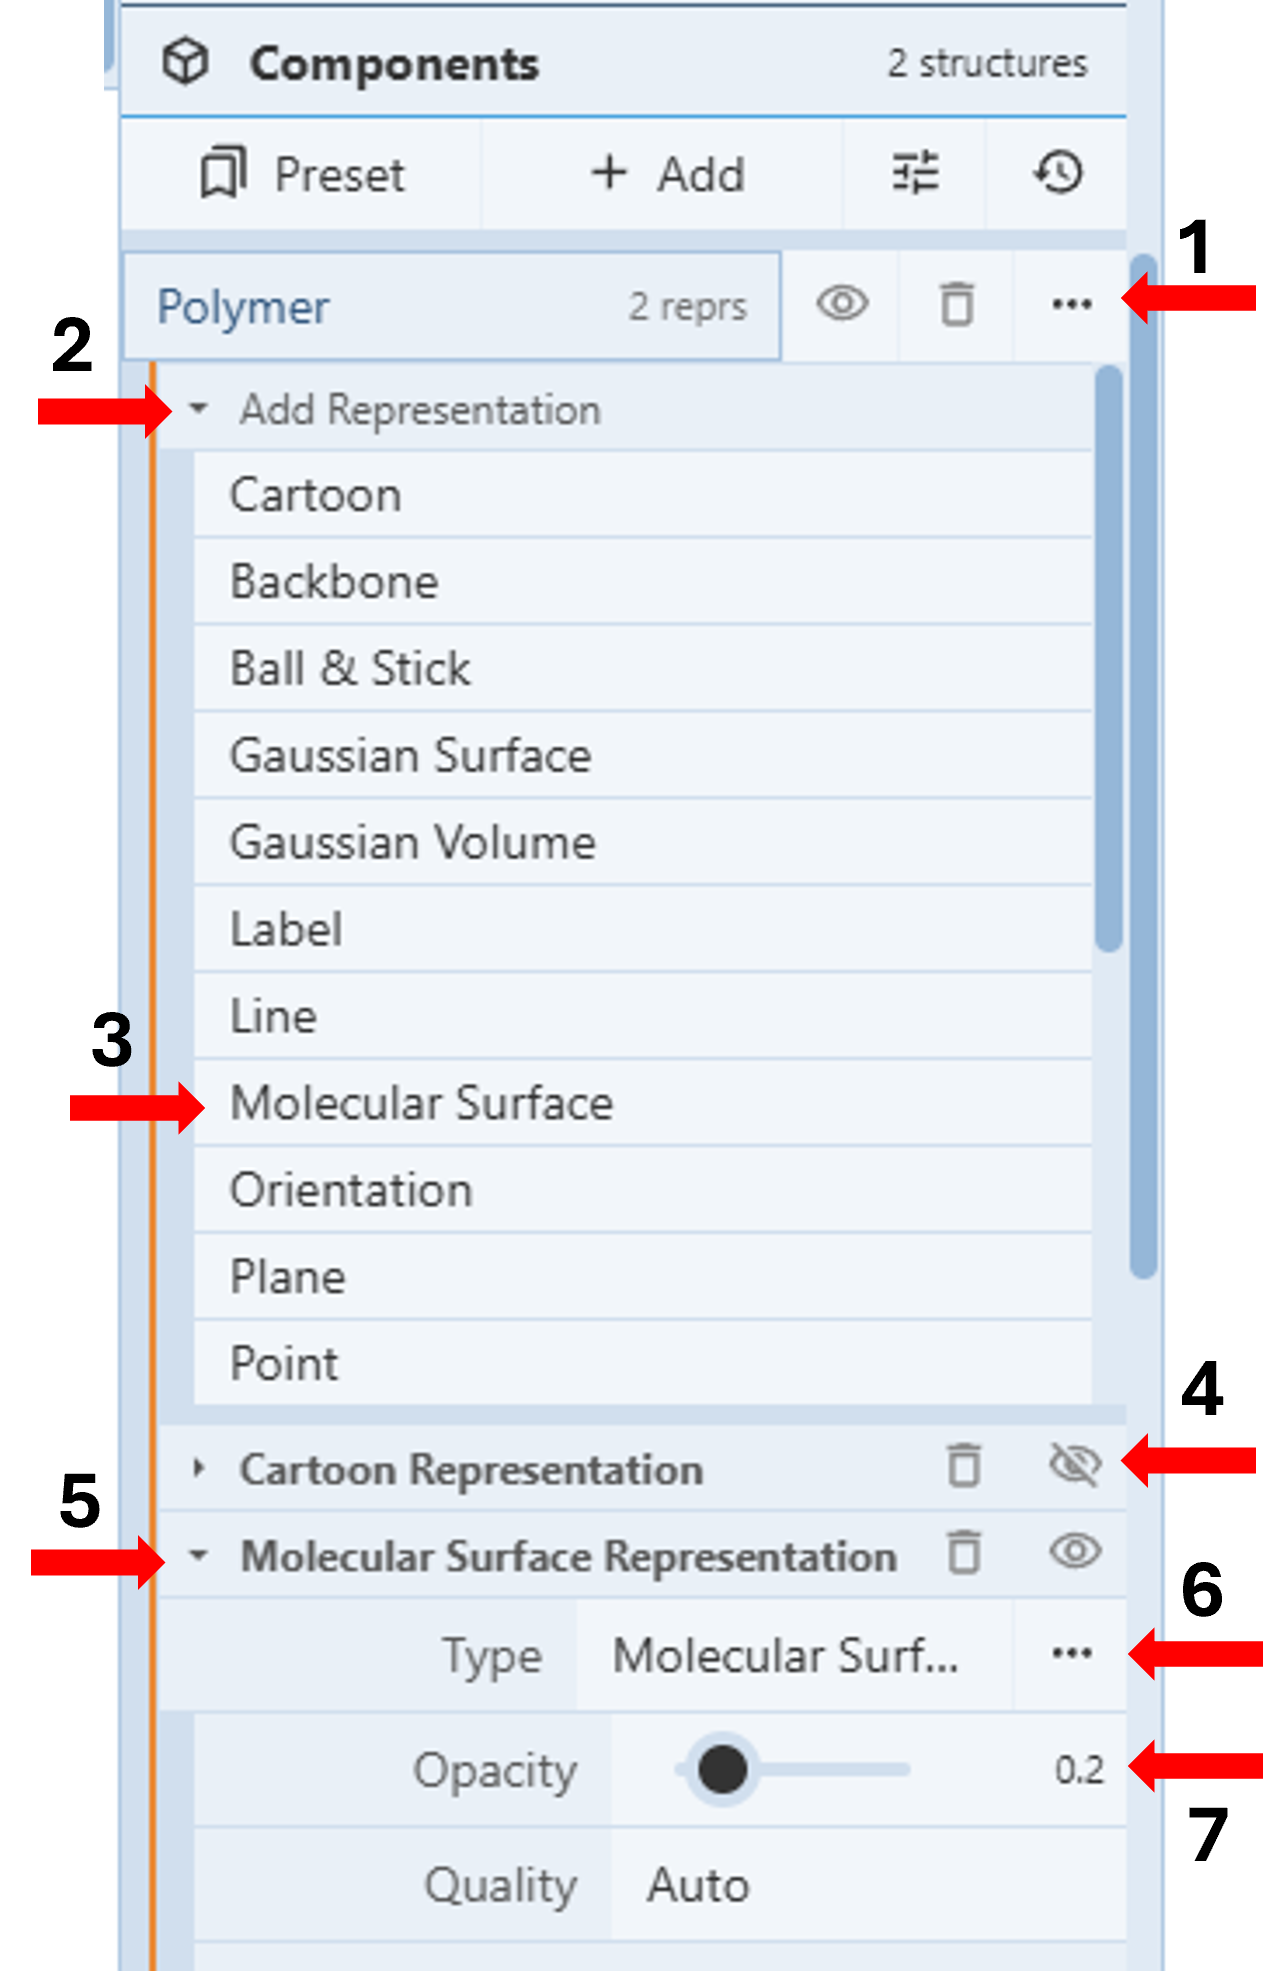
- Click the three dots next to the Polymer Component (Figure 9, Arrow 1)
- Click “Add Representation” (Figure 9, Arrow 2) to activate the drop-down menu with available representations.
- Click “Molecular Surface” (Figure 9, Arrow 3).
- Hide “Cartoon Representation” by clicking the eye icon next to it (Figure 9, Arrow 4).
- Click “Molecular Representation” (Figure 9, Arrow 5).
- Click on the three dots next to the “type” cell (Figure 9, Arrow 6) to access additional controls.
- Set “Opacity” to 0.2. (Figure 9, Arrow 7)
- Add “Molecular Surface” representation to the two newly created components, F96 and F96A, by repeating steps 1-3 for each of the components.
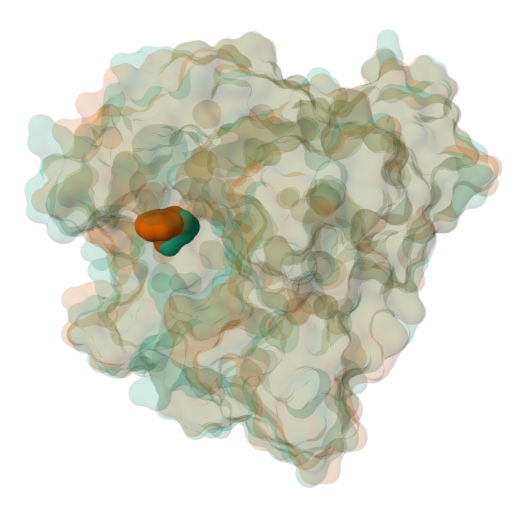
Figure 10: Semitransparent molecular surface representation of the wildtype (brown) and mutated (green) proteins with F96 and the substituted F96A shown in spacefill representation.
Note: This view will allow you to visually compare the volume occupied by the sidechain within the active site pocket (Figure 10).
Comparing molecular interactions within a 5 Å radius of the mutation:
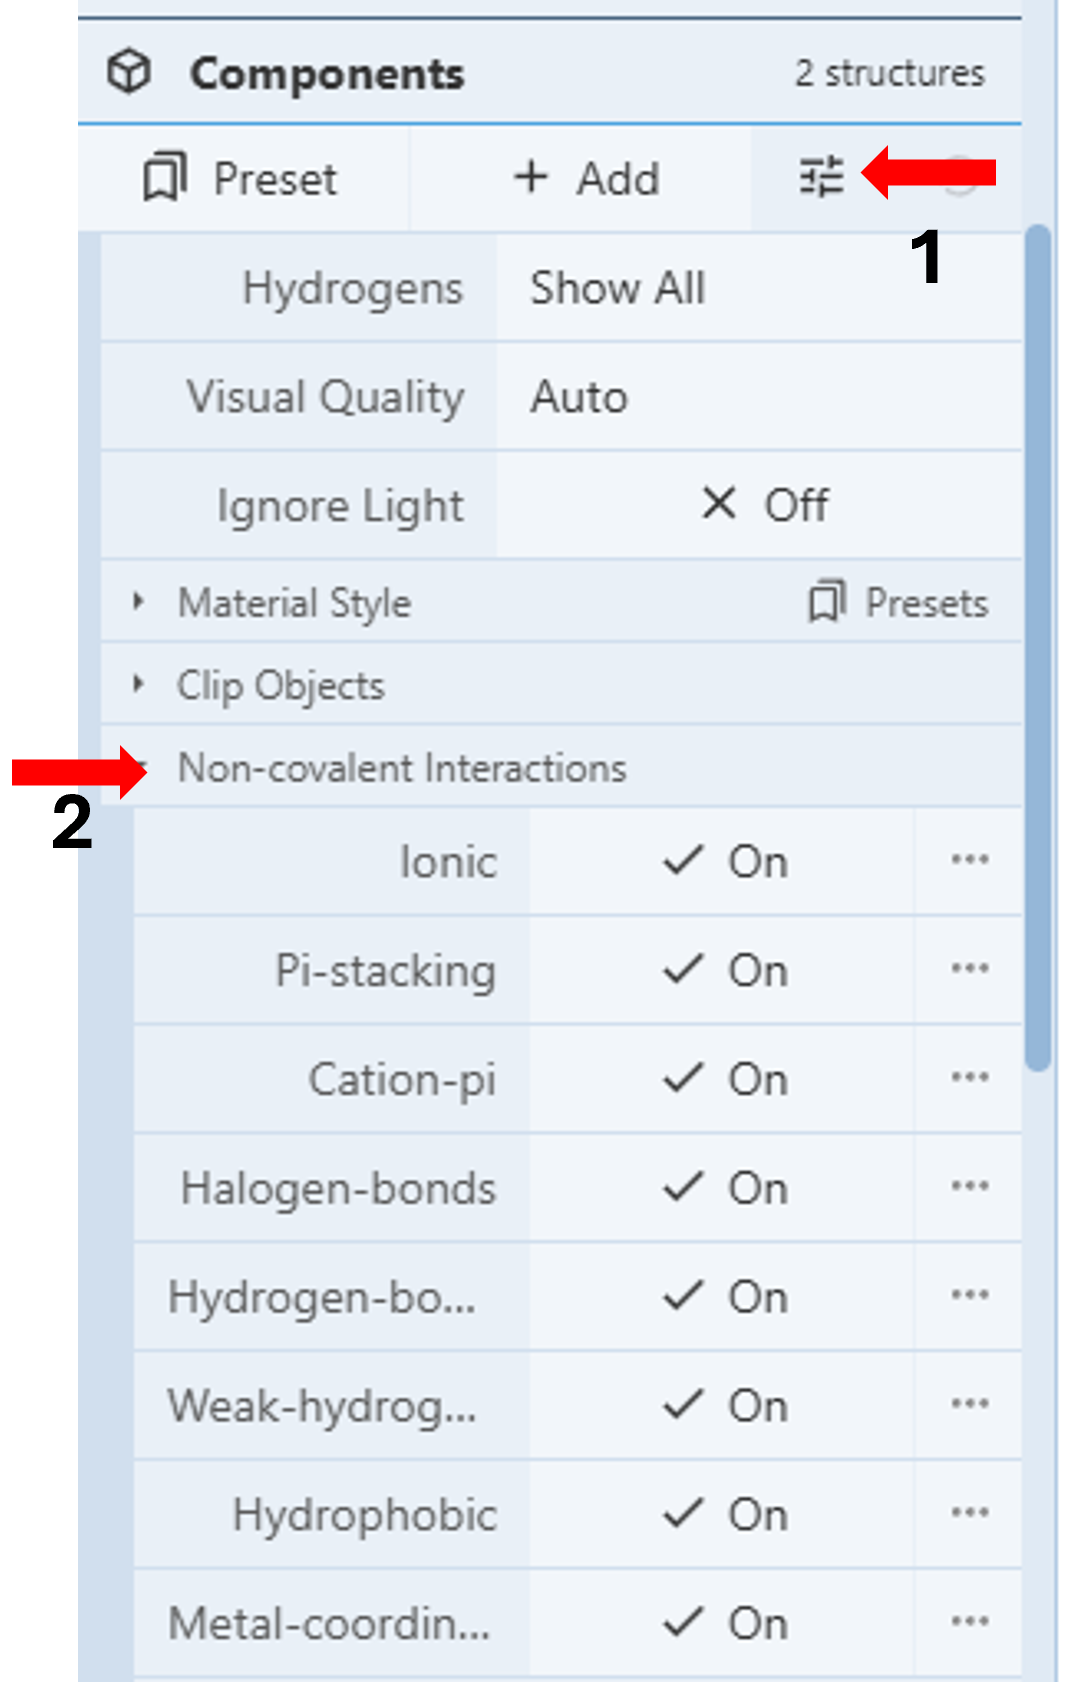
- Click the “Settings” icon in the first row under the Components Panel to access the pull-down menu. (Figure 11, Arrow 1)
- Click “Non-covalent Interactions” (Figure 11, Arrow 2)
- Turn on all the desired interactions by clicking the corresponding on/off toggle.
- Hide “Molecular Representation” from F96 and F96A components by clicking the eye icon next to them.
- Click F96 on the 3D Canvas to zoom into the region within 5Å radius of this residue and display the molecular interactions in this region for the wild type protein (Figure 12, Panel A).
- Click on an empty space on the 3D canvas to reset the zoom.
- Clicking on F96A, to view the corresponding space and interactions for the mutated protein. (Figure 12, Panel B)
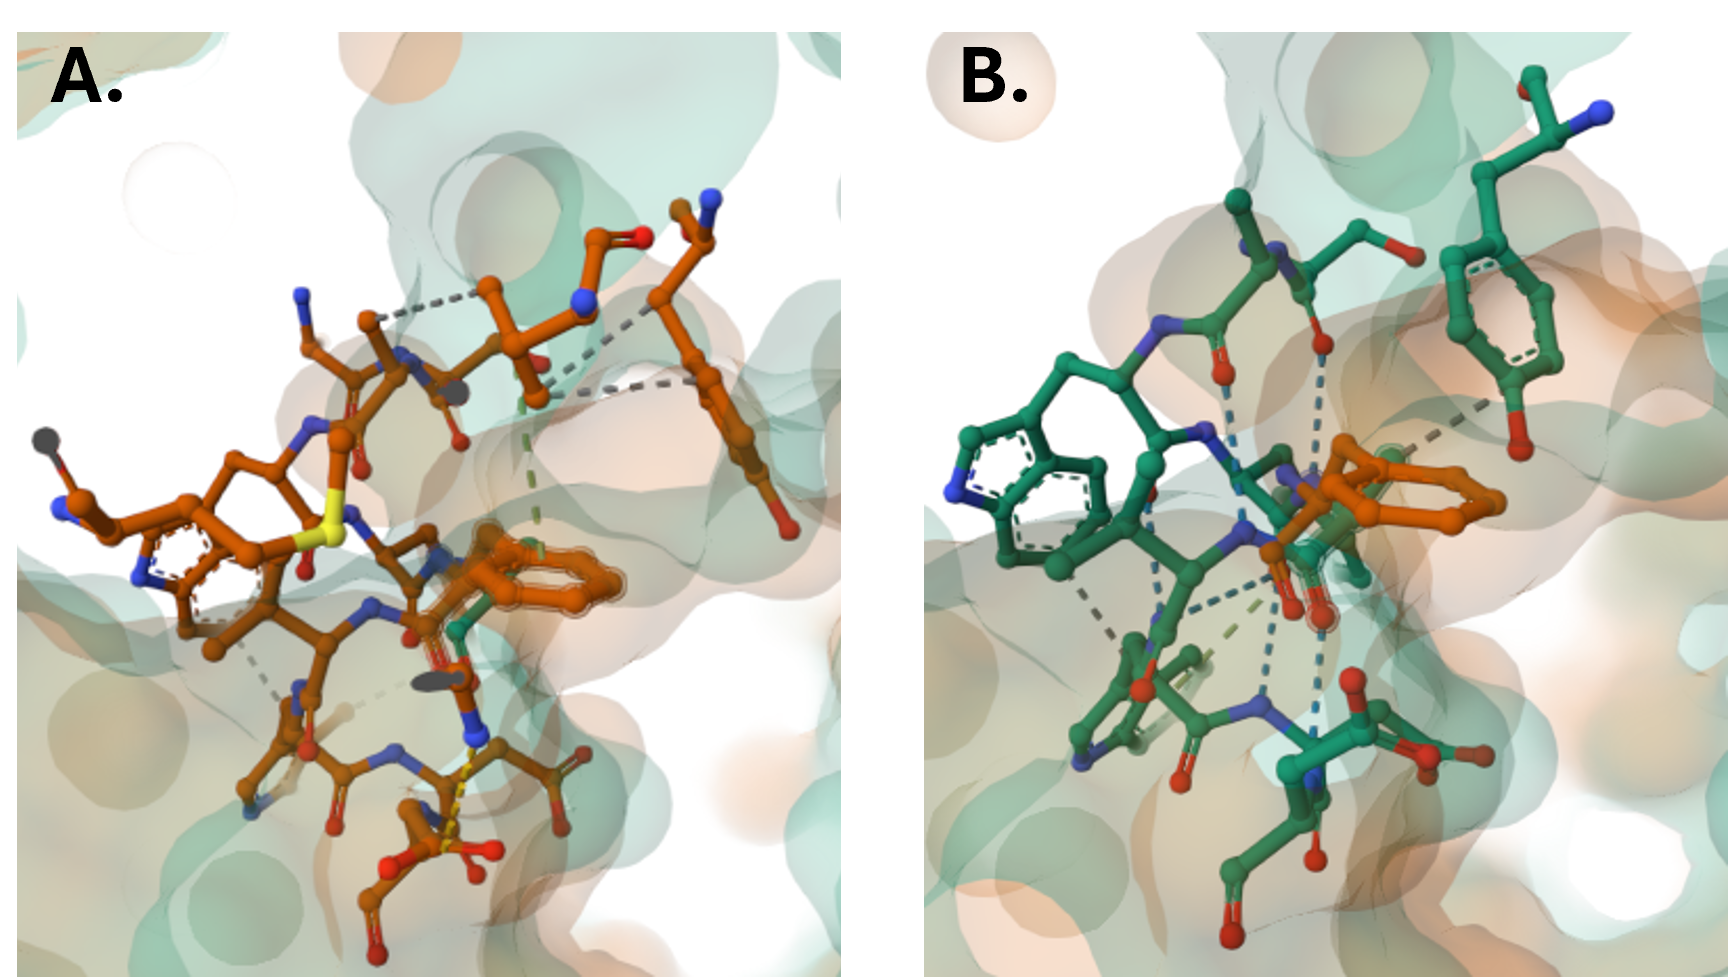
Figure 12: Molecular interactions within a 5Å radius of F96 in the wild-type protein (Panel A) and within a 5Å radius of F96A in the mutated protein (Panel B). Note: For a more quantitative analysis of the changes in the relative positions of these residues with respect to their neighboring residues, use the protocol described in Chapter 9c to measure specific distances.