
VI.D. PyMOL Selecting on the Sequence and Labeling
Roderico Acevedo and Kristen Procko
Overview: This activity demonstrates how to select parts of a macromolecular structure using the sequence display.
Outcome: The user will be able to select parts of a macromolecule using the sequence and purposefully modify their display.
Time to complete: 15 minutes
Modeling Skills
- Using the sequence to create selections
- Labeling parts of the molecule
About the Model
PDB ID: 1xww
Protein: Low molecular weight protein tyrosine phosphatase
Activity: Hydrolyzes Tyr-OPO32- phosphoester bond
Description: Single chain, bound SO42- competitive inhibitor, bound glycerol (nonspecific stabilizer)
Steps
Load the Structure
From the literature, it is known that the active site is a nucleophilic C12. It is part of the phosphate-binding loop (P-loop, AA 12-18: CLGNICR). Let’s find, select, and render these.
- Load 1xww. In the command line, type: fetch 1xww, type=pdb1
- Hide the water molecules. In the names/object panel, next to 1xww, click: H → waters
- Color by secondary structure. click: 1xww → C → by ss (select the choice where sheet is purple)
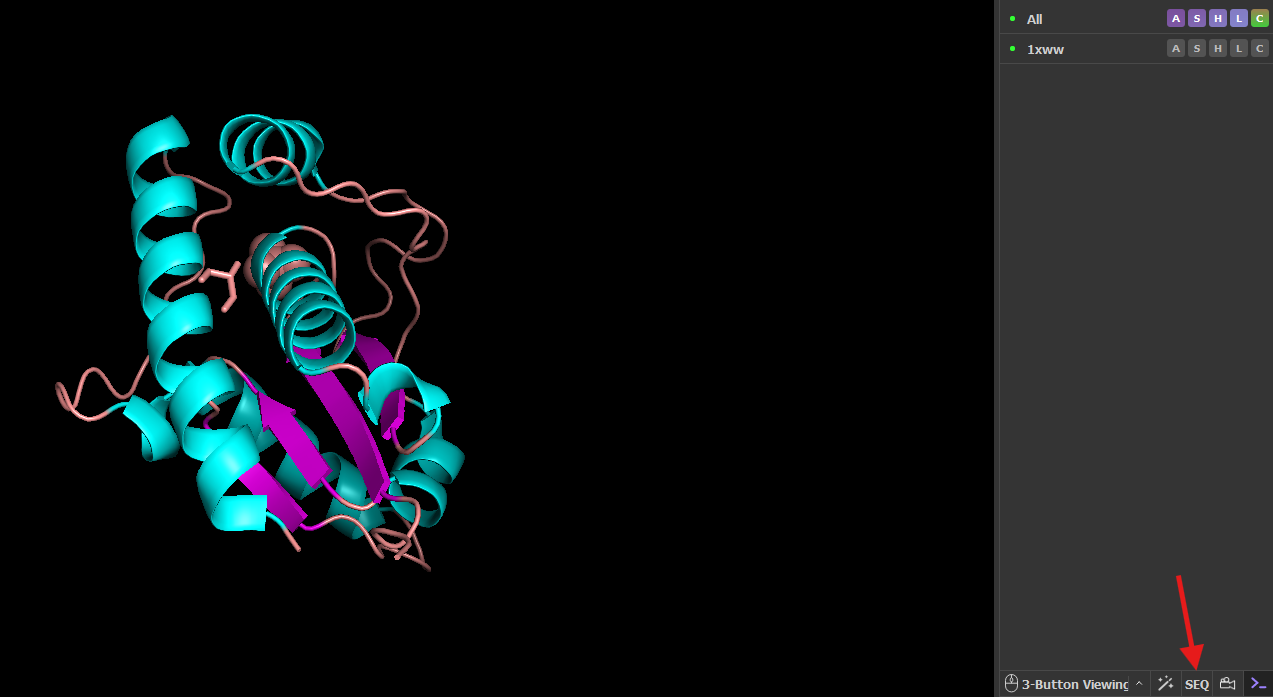
- Turn on the sequence viewer. In the Controls panel, click “SEQ” (red arrow)
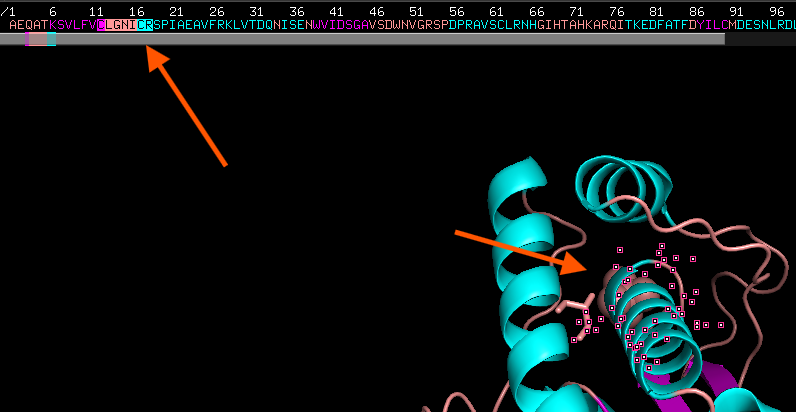
Note: The default sequence display is one-letter codes for amino acids and nucleic acids. The number corresponds to the amino acid that is aligned on the left-hand side of the number (see figure below). Therefore residue 6 is K (Lys), and residue 16 is I (Ile). You can change to three-letter codes in the dropdown menu under Display → Sequence Mode
Find the P Loop
-
Click on C-12 (Cys-12) on the sequence and drag to R-18. Notice the residues become highlighted in the sequence and on the structure in the structure viewer window (orange arrows).
-
Next to the new object in the Names/Object panel, called “(sele)” click the A button: A → rename selection
-
Using the keyboard, delete the letters “sele” that appear on the top left-hand side of the structure viewer window (backspace), and in place of them, type: PLoop
-
In the Names/Object panel, click: PLoop → S → Side Chain → Sticks
-
Then, PLoop → L → residues
Label and Save Image
-
Resize the labels to 14 point font. In the command line, type: set label_size, 14
-
Click anywhere in the empty space of the structure viewer window to clear the selection.
- Using the scroll bar (gray bar in the image above) to scroll to the end of the peptide chain. You’ll notice a break in the string of letters, and then the ligands and water molecules are listed.
Note: The order of the ligands and chains may vary in different structures
-
Find the sulfate ligand, labeled SO4. Click on it and rename the selection “sulfate.”
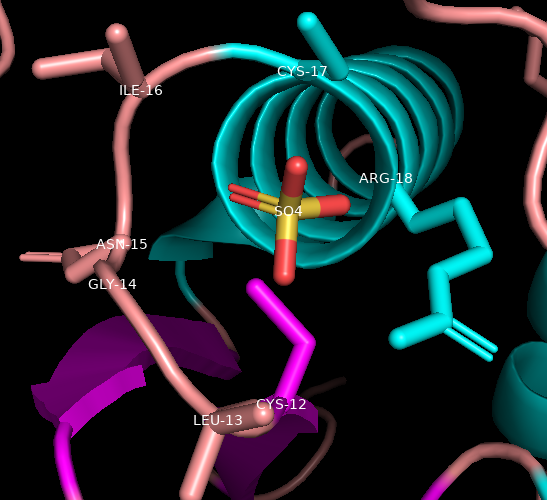
Figure 3: results from labeling residues that are close to the sulfate ion. -
Display the sulfate as sticks
- Color the sulfate by element by clicking, C → by element → click where carbon is black (first option)
-
Under dropdown menu, click on “Residues” and change to “Atoms”
-
In the structure viewer, click on the sulfur atom of the sulfate molecule
-
In names/object panel, beside (sele), click L → residue name to label the sulfate
- Sometimes the labels seem to be hiding behind the image, to correct this, in the command line, type: set float_labels, on
-
Change the background to white, save the session file, and save a PNG image.
Click here to go to Chapter VII: 5A Selection