
II.D. PyMOL Changing Color and Representation (Alternative Renderings)
Roderico Acevedo and Kristen Procko
Overview: This chapter shows how to change the representation (rendering) of a protein in PyMOL.
Outcome: The user will be able to select a particular rendering for a purposeful display of a protein.
Time to complete: 5–10 minutes
Modeling Skills
- Loading structure
- Alternative renderings
- Saving files
About the Model
PDB ID: 1XWW
Protein: Low molecular weight protein tyrosine phosphatase
Activity: Hydrolyzes Tyr-OPO32- phosphoester bond
Description: Single chain, bound SO42- competitive inhibitor, bound glycerol (nonspecific stabilizer)
Steps
Load Structure
-
Open PyMOL by double-clicking on the application.
- In the top command line, type: fetch 1XWW, type=pdb1
Note: Default render is ribbon (cartoon) with black background, and small molecules shown as sticks or spheres (sulfate is shown as spheres, glycerol as sticks).
Alternative Renderings
-
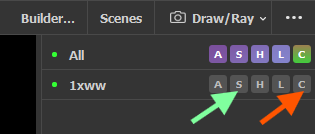
In the names/object panel, next to 1xww click the “S” (Show) button (Figure 1, green arrow) to display the structure in different ways. Each new representation is layered on top of the others.
Try:
S → lines
S → wire
S → ribbon
- Click the “H” (Hide) → ribbon to hide the ribbon presentation. This can be repeated for every representation.
- Now, try clicking “Show As” in the “S” button menu. This clears prior representations and only applies only the new representation to the structure.
Try: S → as → cartoon
-
For your favorite representations, click the “C” (Color) button (Figure 1, orange arrow). Try the “by element” and “by ss” (secondary structure) coloring schemes.
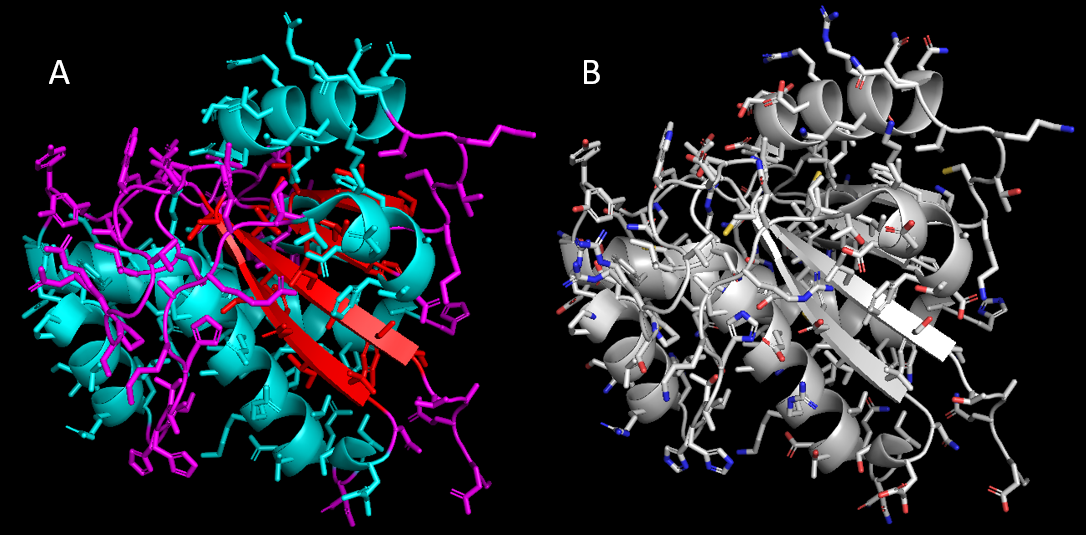
- Click: C → by ss → the option where helix is red
-
To display side chains, click: S → side chains → sticks
-
To Ensure the main chain is hidden, click: H → main chain
-
Apply the coloring in Step 6 and note the difference in sidechain display.
Saving Files
There are two main file types for PyMOL. One is the “session file” that you can reopen and work on in PyMOL. The others are image files; PNG is a 2D file, and the other choices are 3D exports.
- Use the dropdown “Display” menu and select: Background → White
- In the file menu, click “Save Session”, select the location and type a file name.
Note: Images can be made using the file menu, as well. In the file menu, click: Export image as → PNG
- In the Building buttons panel, click the “Draw/Ray” tab (see image above for camera icon).
- In the pop-up window, click “Draw” (faster rendering) or Ray (higher quality, but slower rendering).
- Click: “Save Image to File” to save as a PNG file.
Click here to go to Chapter III: Surfaces