
IV.C. Mol* Viewing Biological vs. Asymmetric Units
Didem Vardar-Ulu and Shane Austin
Overview: The activity in this chapter demonstrates different ways to display structures (e.g., biological vs. asymmetric units).
Outcome: The user will explore different tools to load/display information related to biological/asymmetric units.
Time to complete: 10 minutes
Modeling Skill
- Display biological vs. asymmetric units
About the Models
PDB ID: 1hho
Protein: Oxy-hemoglobin
Activity: gas transport in red blood cells
Description: tetramer, bound heme prosthetic group with bound oxygen, phosphate ligand
PDB ID: 1pb5
Protein: prototype LNR Module from Human Notch1
Activity: part of transmembrane receptor that control differentiation
Description: NMR structure of monomer bound to calcium ion, 16 conformers
Background
The asymmetric unit of a crystal structure can represent either: (a) the complete biological unit (i.e., the biochemically active form of a biomolecule); (b) a portion of the biological unit; or (c) multiple copies of the biological unit. The “asymmetric unit” is equivalent to the biological unit (correct oligomeric functional state) in approximately 60% of structure records. The RCSB PDB has a detailed page explaining the asymmetric unit, with examples.
mmcif Files
Mol* supports the mmCIF (macromolecular Crystallographic Information File) format. It can read both standard mmCIF files (.cif) and compressed binary mmCIF files (.bcif) which improves loading speeds and reduces file sizes, especially for large structures. This allows for fast and efficient visualization of large macromolecular structures within the web browser, even on mobile devices.
Steps
Load the Structure:
- Go to rcsb.org, which opens in a new tab.
- In the search bar at the top, type 1hho and press Enter.
- On the landing page, click the “Structure” tab next to the highlighted “Structure Summary”
Manage Display:
The Structure Panel allows the user to display the structure as the deposited coordinates of the asymmetric unit called the Model or various assemblies of the deposited coordinates.
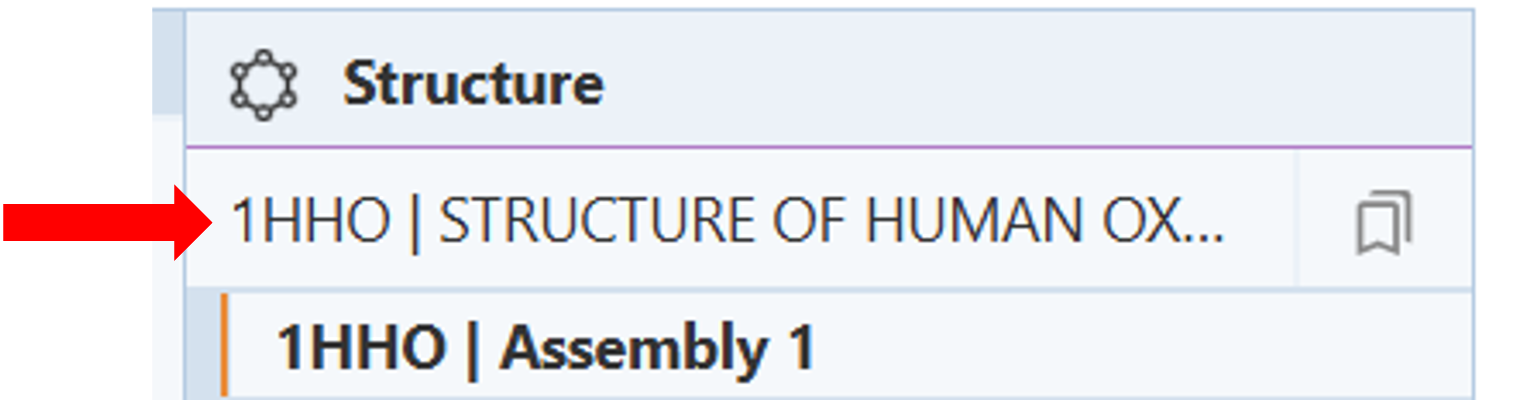
- Click on the structure name to access the dropdown menu of the structure(s) that are present. (Figure 1).
Note: When multiple structures are being displayed, structures can be set as active or inactive by selecting a structure using its PDB identifier.
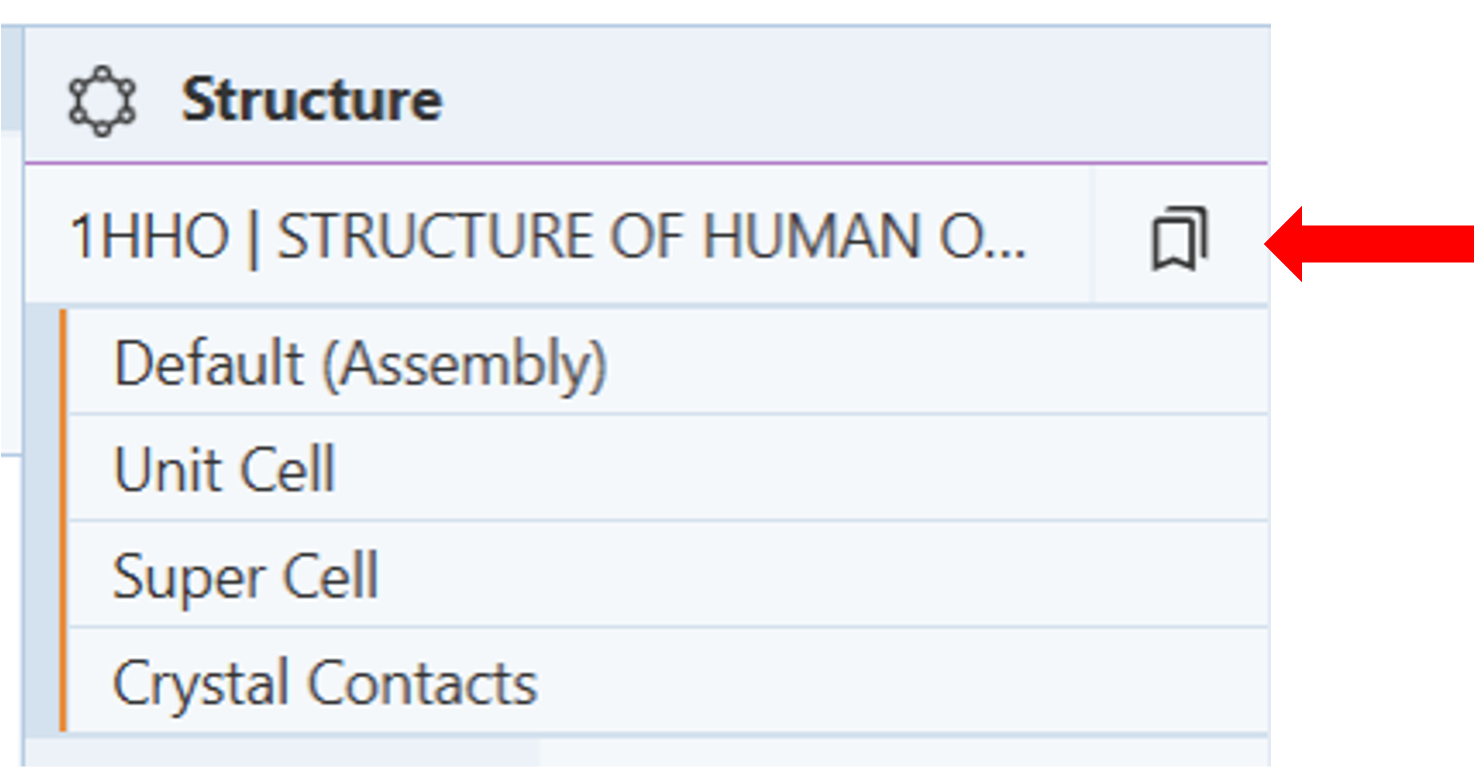
- Click on the presets button next to the structure name to access the drop-down menu of alternate views of the structure. (Figure 2)
- Click on the cell next to “Type” to select the type of view. E.g.: Assembly (Figure 3)
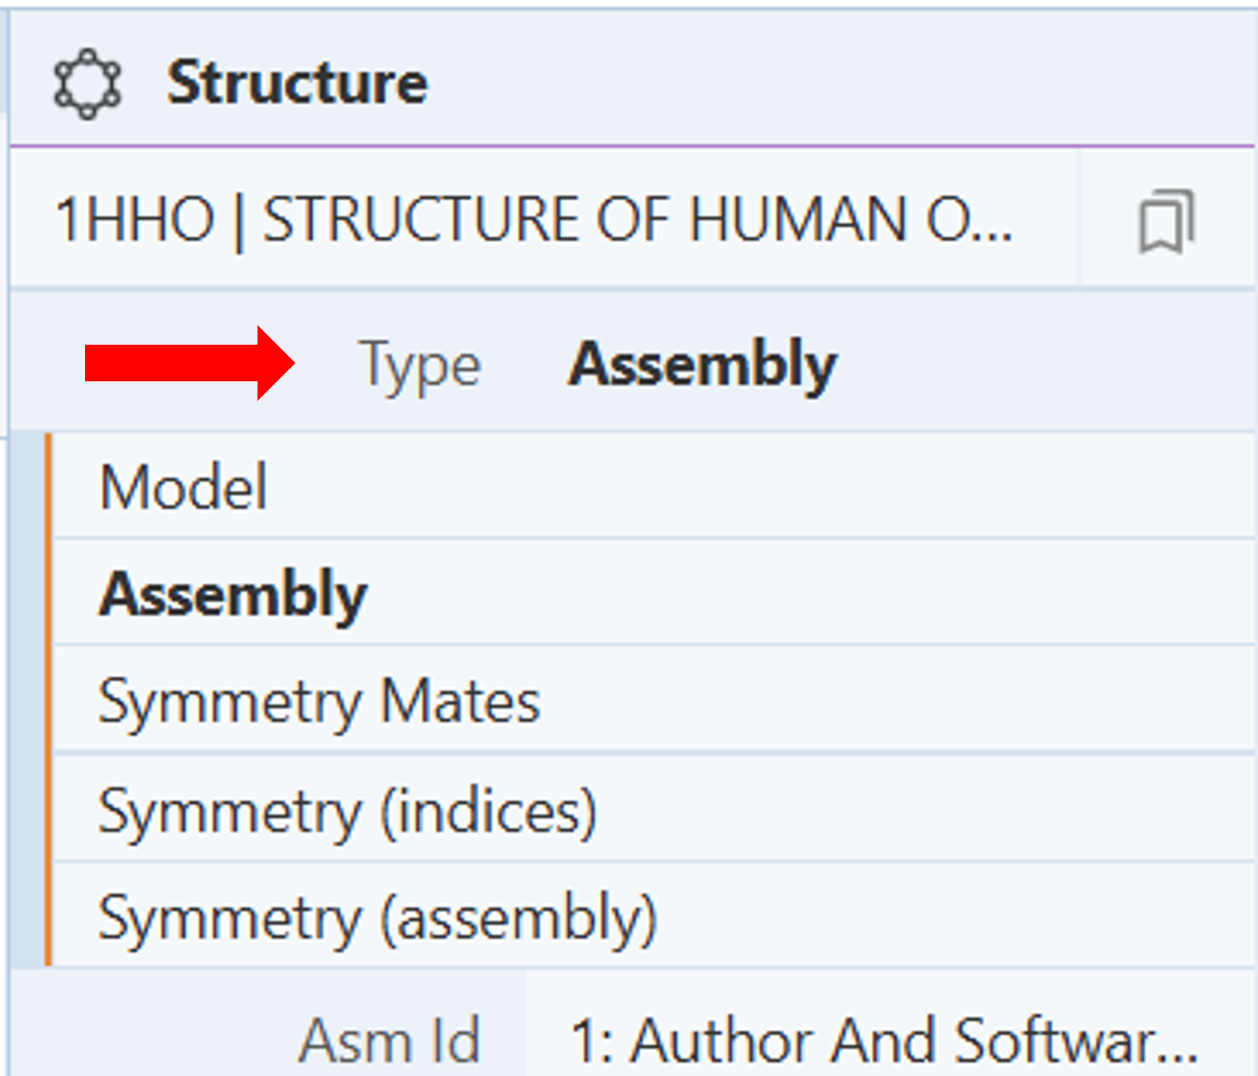
Note: “Model” represents the asymmetric unit, while “Assembly” shows the molecule or structure with any symmetries that were identified in the structure data. Asm ID displays whether the assembly is author and/or software-defined.
NMR structures deposited as ensembles have multiple models in the coordinate file. (Figure 4)
- Go to rcsb.org
- In the search bar at the top, type 1pb5 and press Enter.
- On the landing page, click the “Structure” tab next to the highlighted “Structure Summary”.
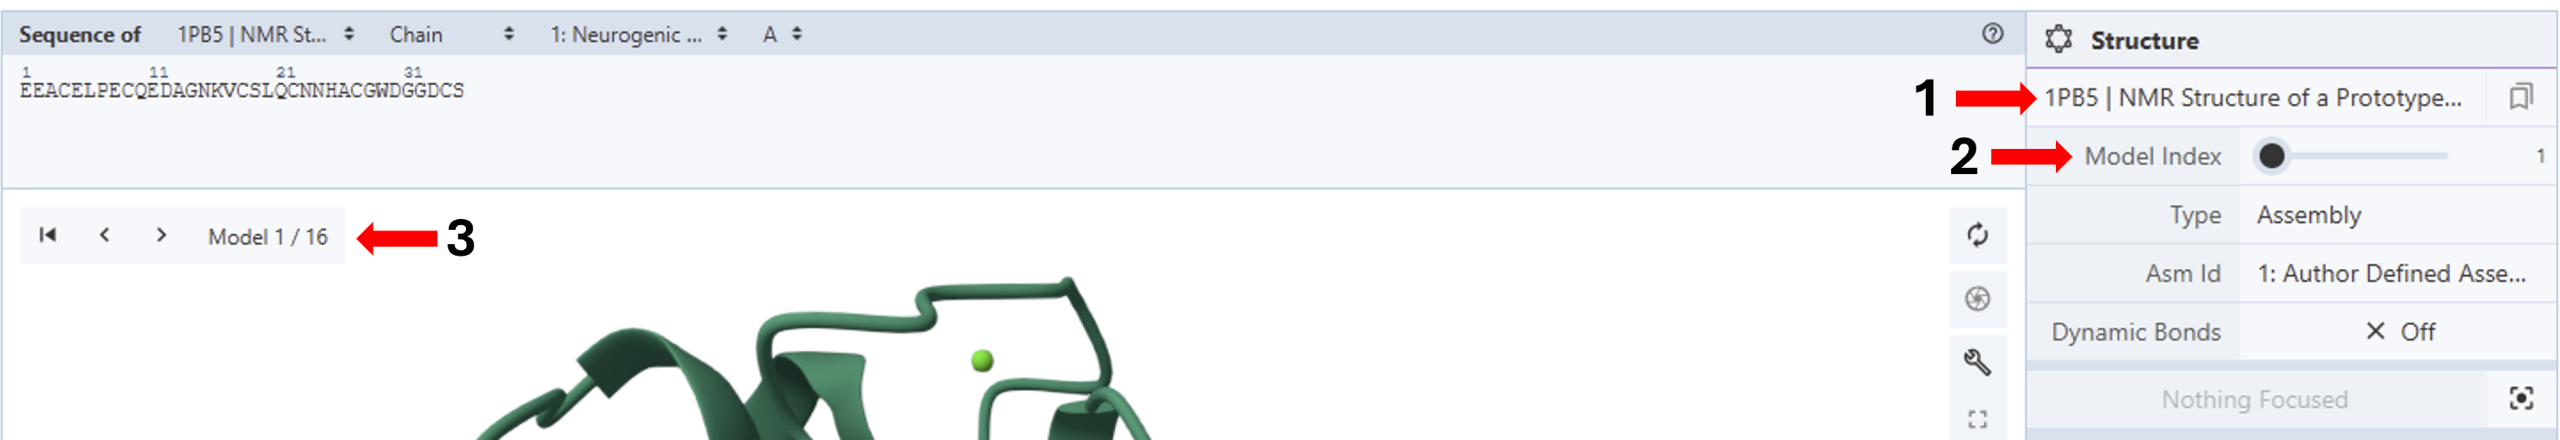
Figure 4: Using the model index to scroll through various models. See text for arrow descriptions. - Click on the structure name to see the number of structures that are present. (Arrow 1)
Use the “Model Index” slider to scroll through the various models. (Arrow 2)
Note: You can also use the arrows in the top-left corner of the 3D canvas to scroll through the various models. (Arrow 3)
Jump to the next Mol* tutorial: V.C. Mol* Selection and Labeling