
II.C. Mol* Changing Color and Representation (Alternative Renderings)
Didem Vardar-Ulu and Shane Austin
Overview: This chapter shows how to change the representation (rendering) of a protein in Mol*.
Outcome: The user will be able to select a particular rendering for a purposeful display of a protein.
Time to complete: 15 – 20 minutes
Modeling Skills
- Loading structure
- Alternative renderings
- Saving files
About the Model
PDB ID: 1xww
Protein: Low molecular weight protein tyrosine phosphatase
Activity: hydrolyzes Tyr-OPO32- phosphoester bond
Description: single chain, bound SO42- competitive inhibitor, bound glycerol (nonspecific stabilizer)
Steps
Load Structure
- Go to rcsb.org
- In the search bar at the top, type 1xww and press Enter.
- On the landing page, click the “Structure” tab next to the highlighted “Structure Summary” tab to open the user interface and load the structure.
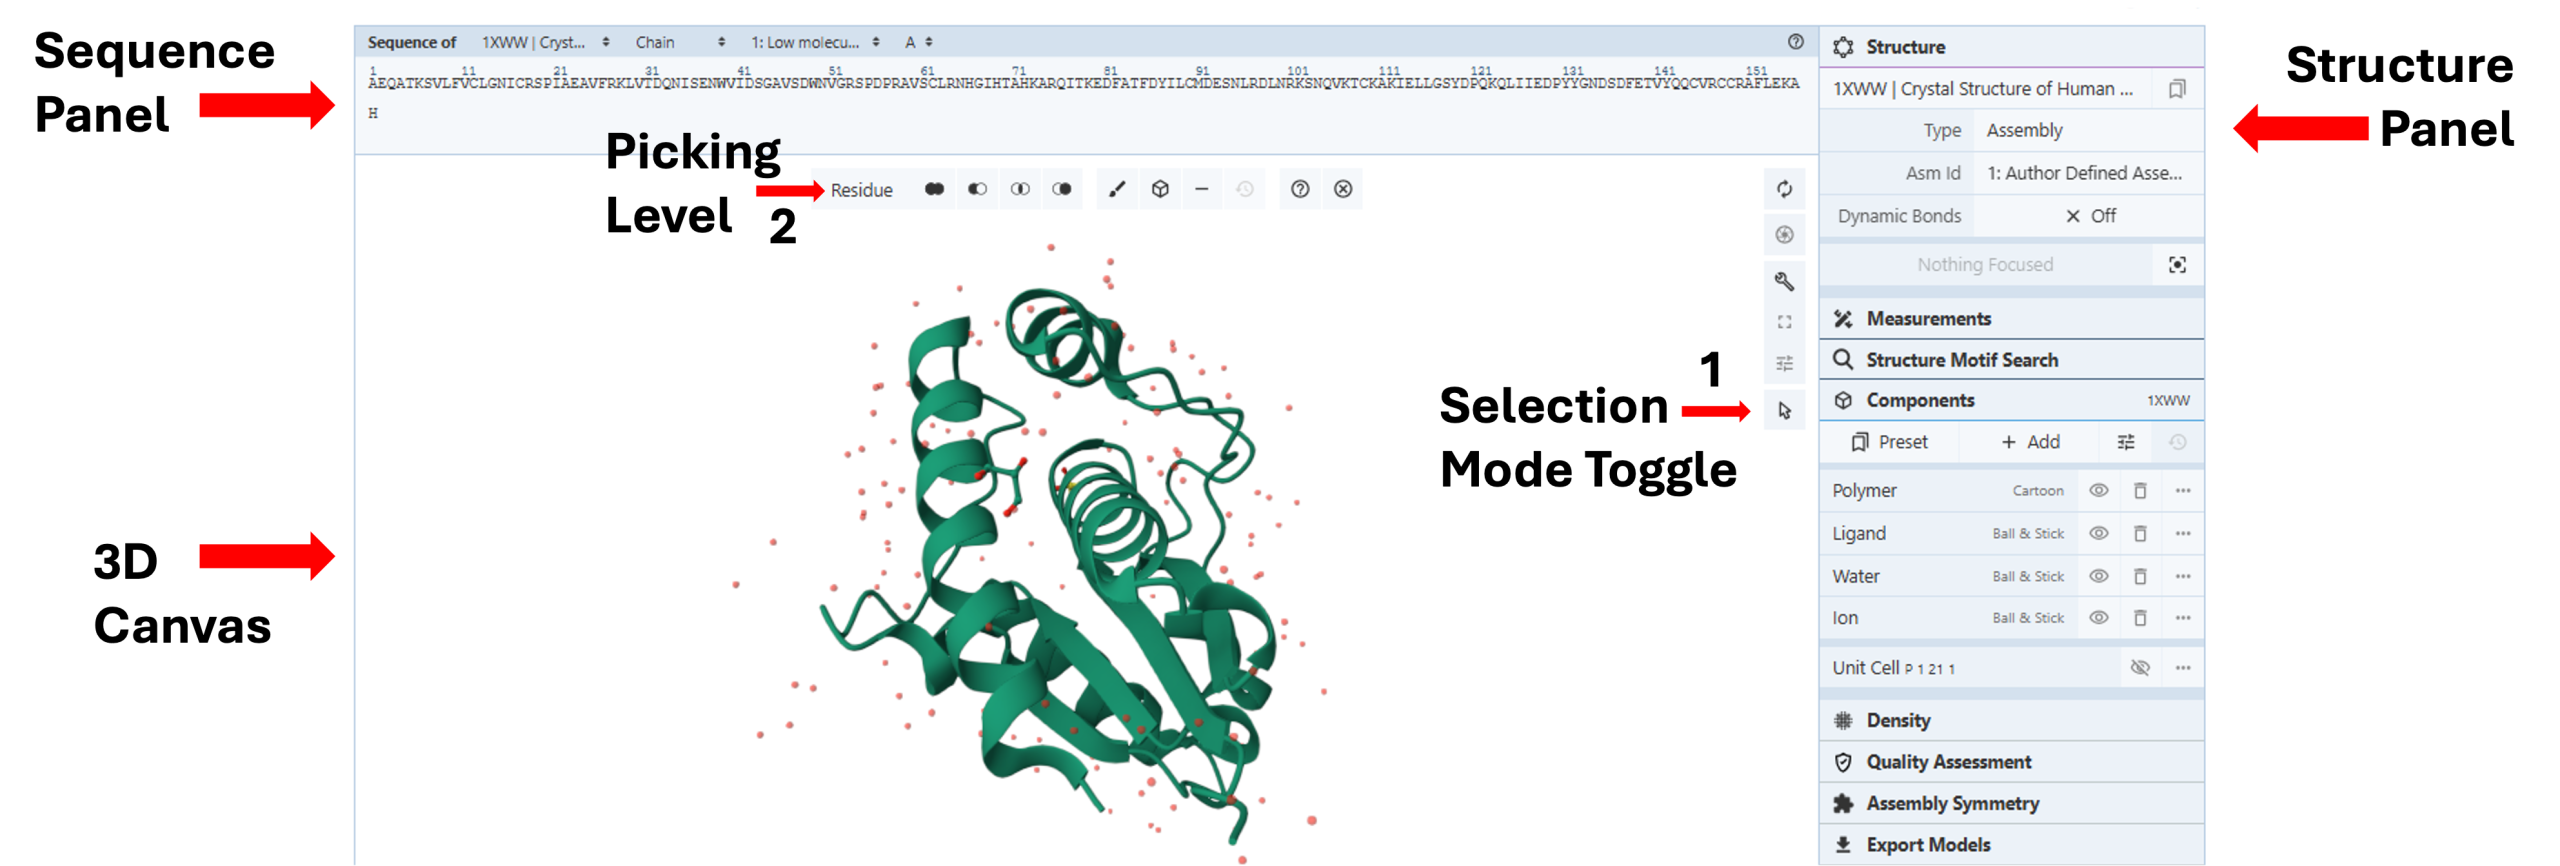
Note: The four components of the loaded structure are listed separately in the control panel on the right of the 3D Canvas. The default polymer (protein) render is a green ribbon (cartoon) with a white background. The ligand (small molecule) and the ion are shown as balls and sticks using default element coloring (sulfur yellow, oxygen red, and carbon green). The water molecules in the structure are displayed as red spheres.
-
Select component to modify (Figure 1)
-
-
- Activate the “Select Mode Toggle”(Figure 1) by clicking the “cursor” icon (Arrow 1).
- Click the word “Residue” (Arrow 2) to select your picking level (E.g., Chain).
- Click any of the molecules or ions on the 3D canvas to select them for modification.
-
Note: When a component is selected, a green highlight will appear around it in both the sequence and the structure.
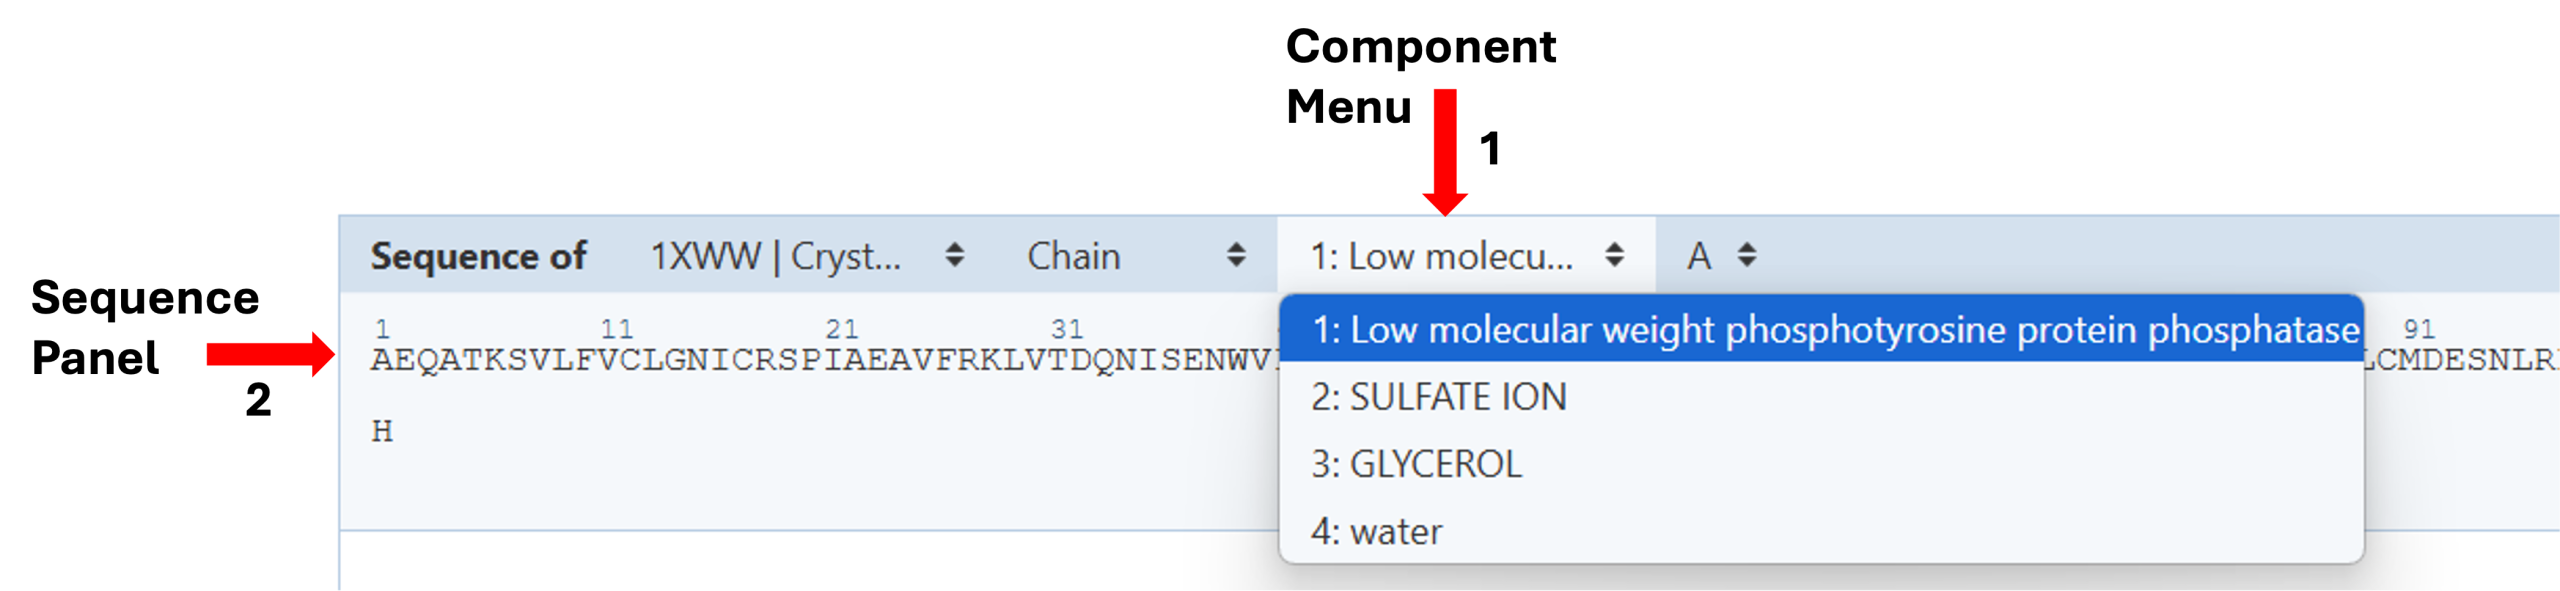
Note: You can also select residues or chains from the sequence panel (Figure 2).
a. Choose the relevant sequence from the drop-down component menu (Arrow 1).
b. Click on the desired elements on the sequence panel (Arrow 2).
Alternative Renderings
-
Change colors (Figure 3)
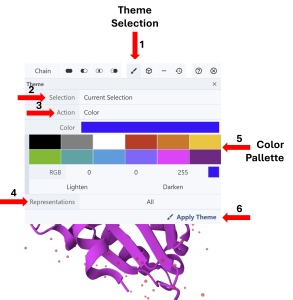
Figure 3: Changing color -
-
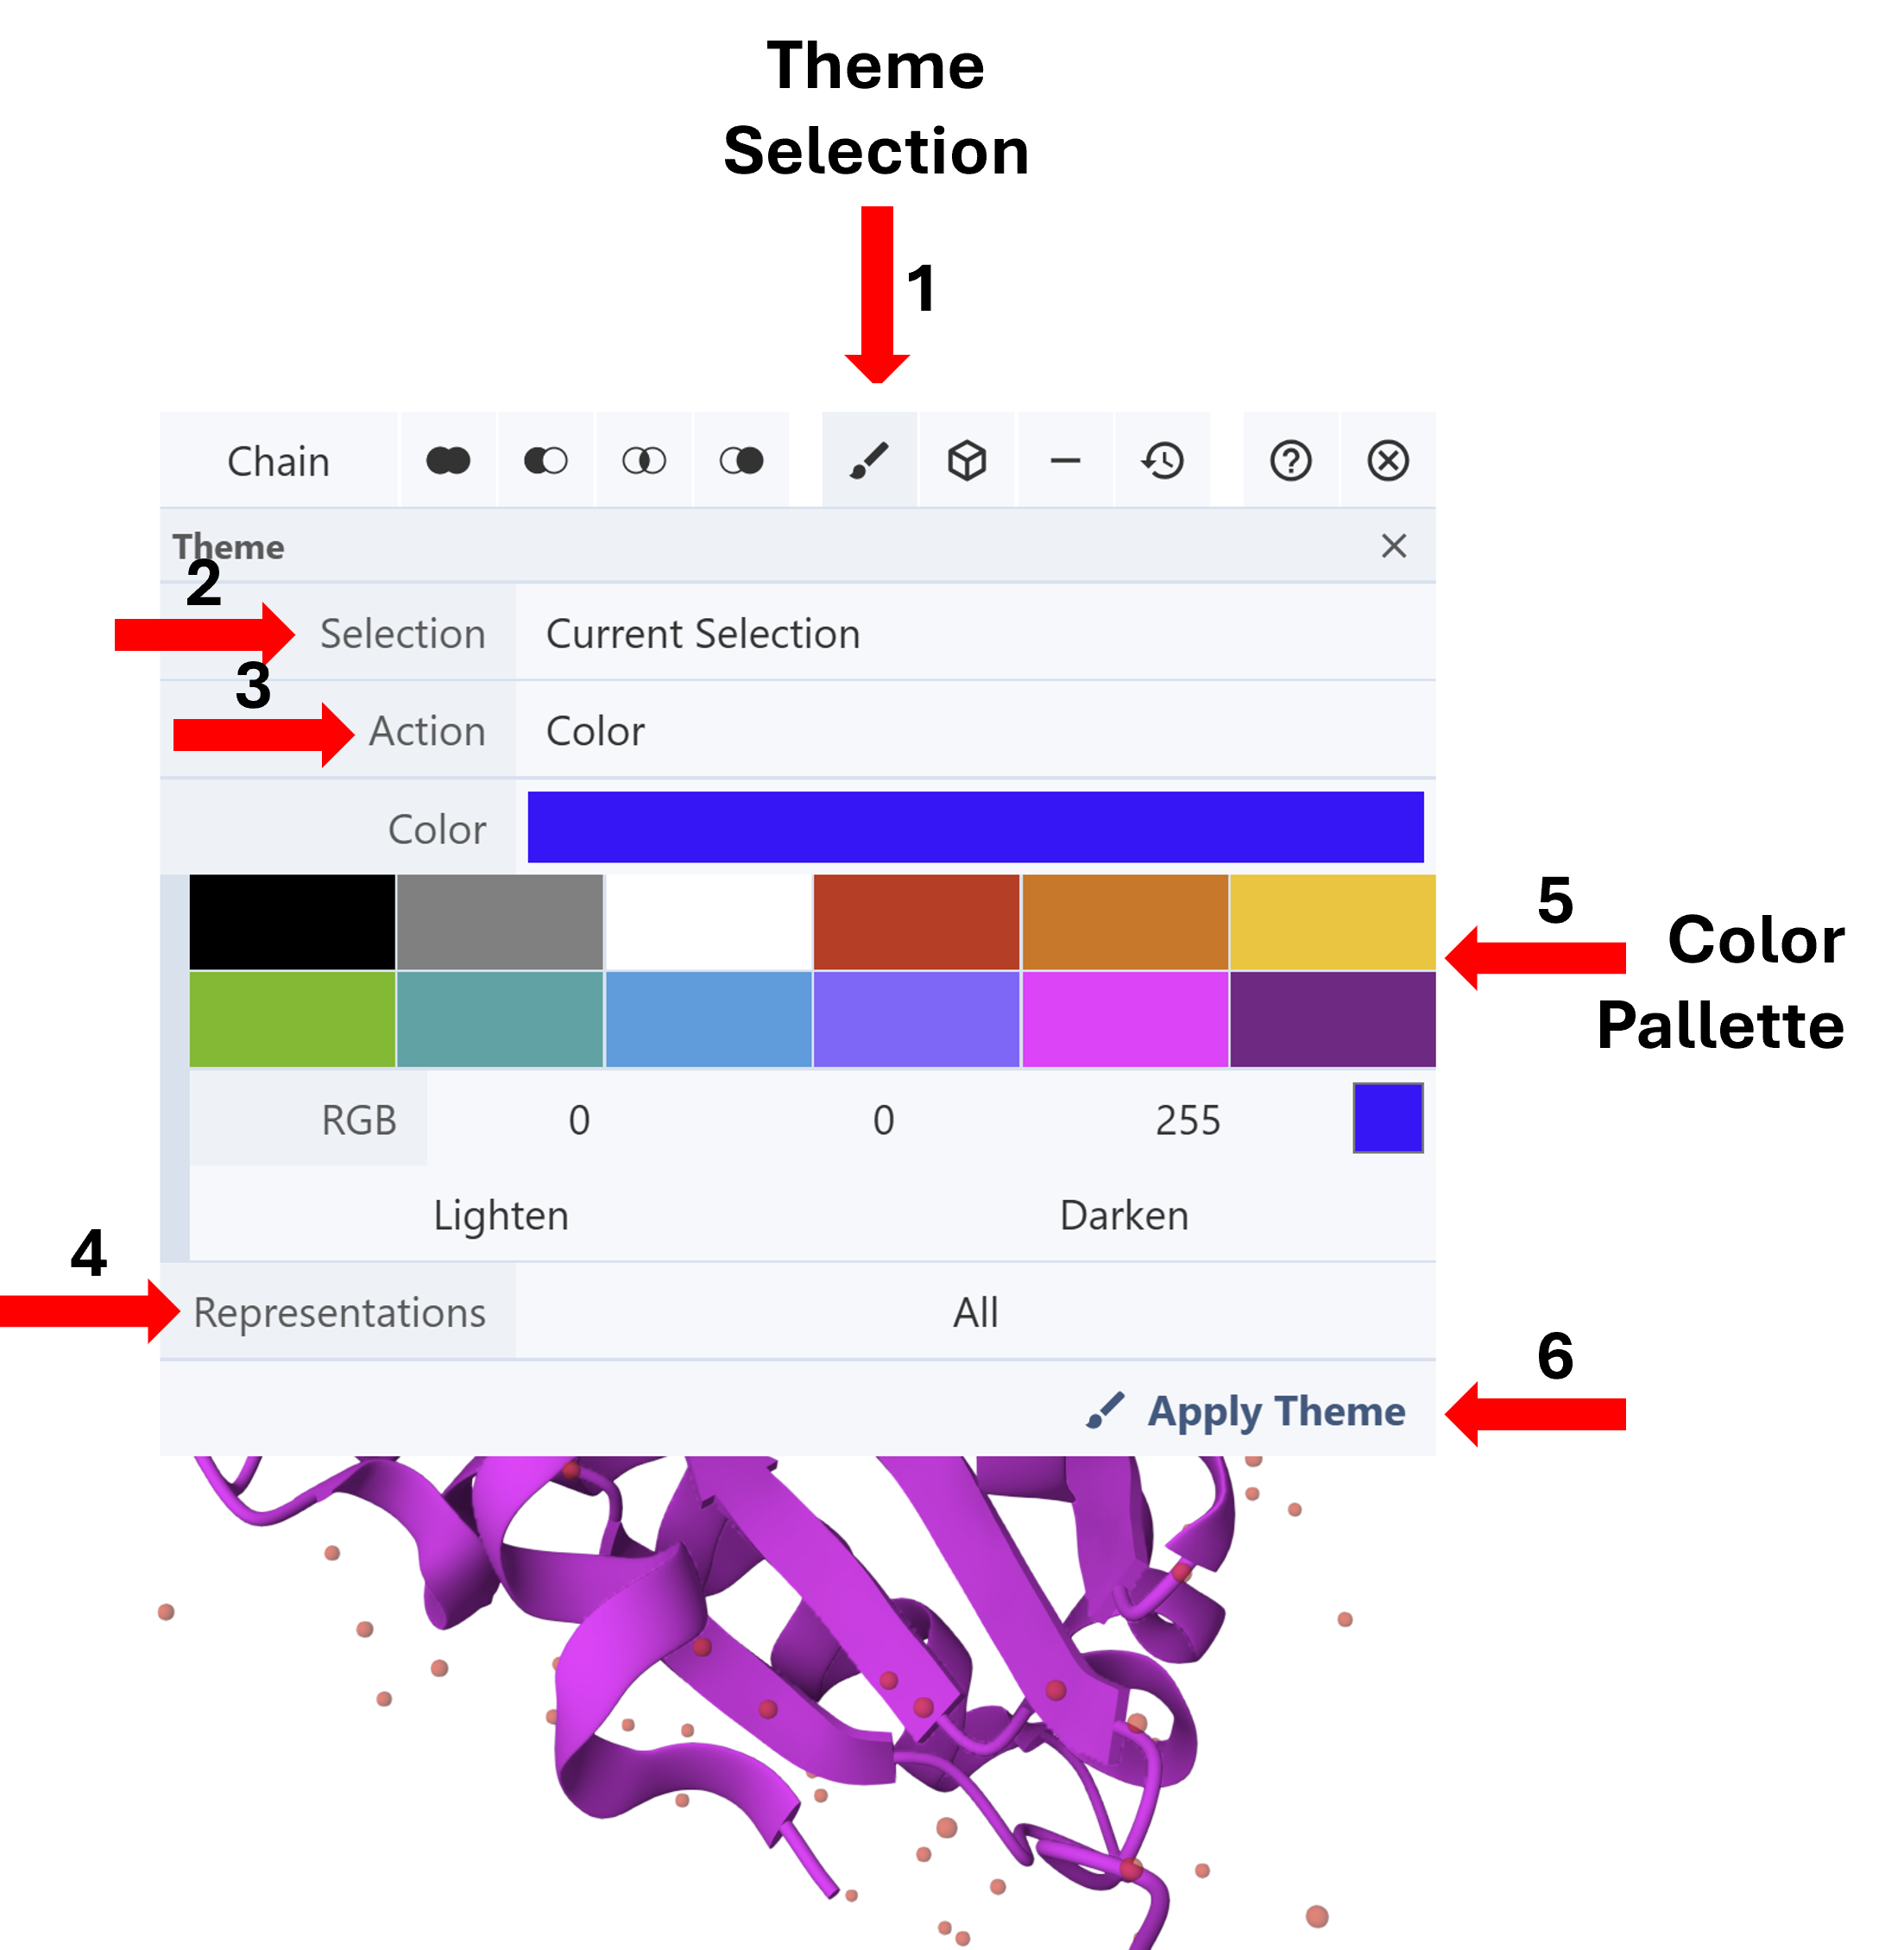
- Click the paint brush icon on the selection bar to open the “Theme” panel (Arrow 1). This panel allows for three independent controls, which can be activated by clicking on the cell showing the default choice. “Current Selection” is the default for theme selection (Arrow 2), “Color” is the default theme action (Arrow 3), and “All” is the default theme representation (Arrow 4). The color action is activated by default, giving direct access to the color palette (Arrow 5).
- Choose a desired color using the preset colors or create a new color using the RGB tool or the Lighten/Darken buttons.
- Click “Apply Theme”.
- To reset the selection’s color, change the theme action (Arrow 3) to “Reset Color” from the dropdown menu activated when “Color” is clicked, and then click “Apply Theme.” (Arrow 6)
-
-
Note: After adding different representations to your structure (next section), you will be able to select any specific representation to color by clicking “All” in the cell for “Representation” (Arrow 4) and selecting the desired representation from the dropdown menu. Note that this dropdown menu is long so you may need to click “1 of 15” that appears in the “Representation” cell after you make your selection. You can only color displayed representations. You can also color any representation using different color themes such as atom or residue properties as described in Chapter IIIc: Color the Molecular Surface
-
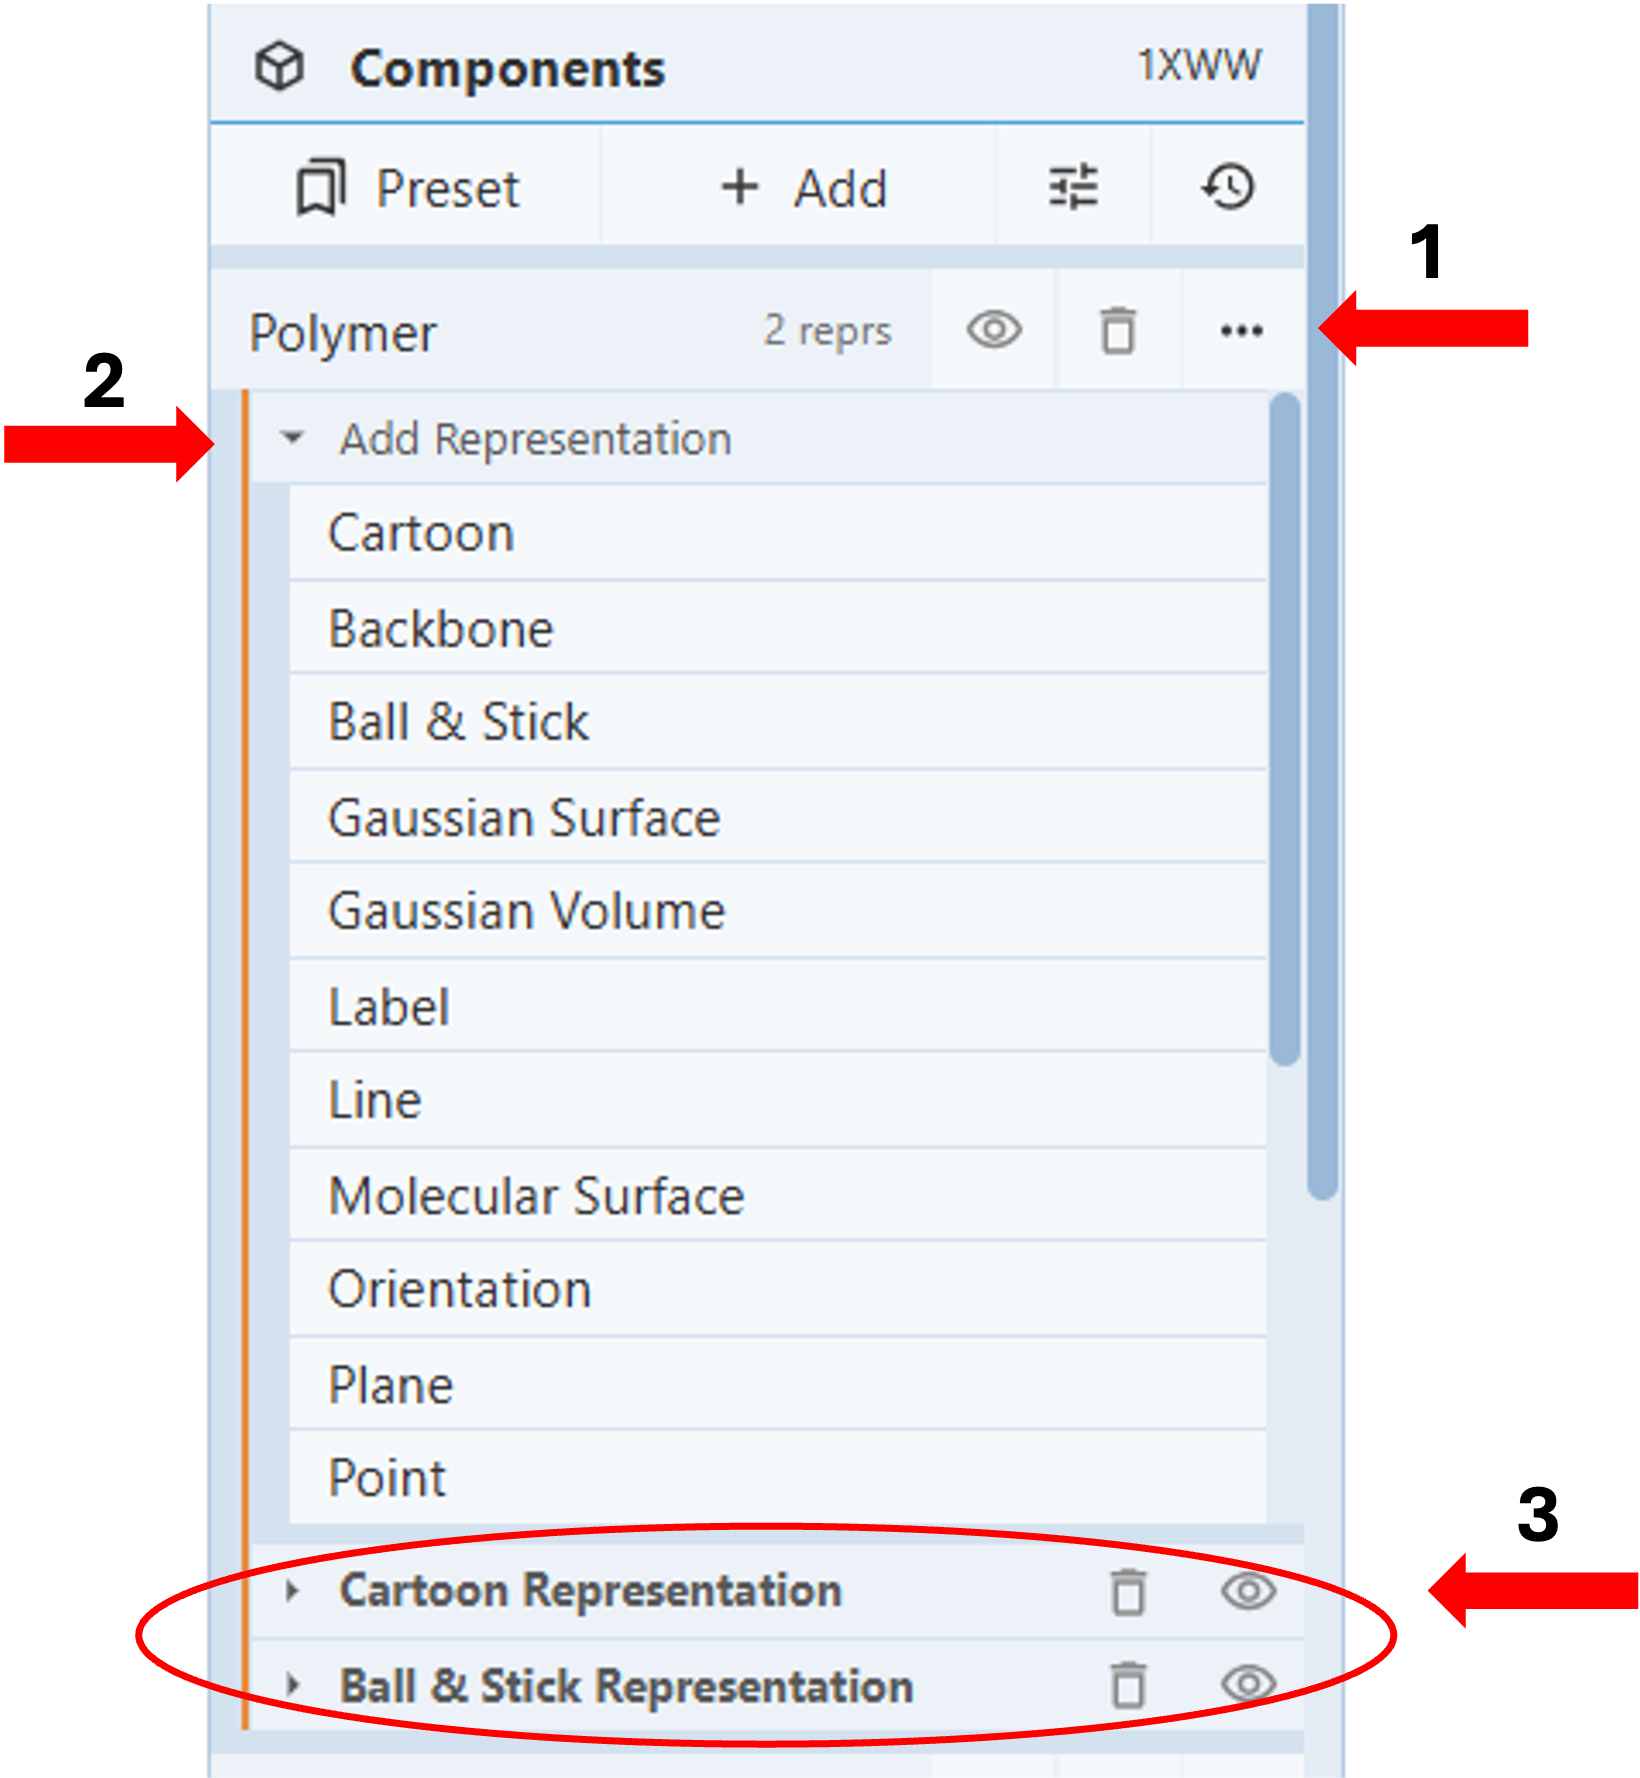
Add representation (Figure 4)
The “Structure panel” on the right of the 3D canvas lists the components of a loaded structure.
Note: Each component is visible by default. You can “unhide” it by clicking on the “eye” icon, delete it by clicking on the “trash can” icon, or access hidden controls to modify it by clicking the three dots next to the component name (Arrow 1).
-
-
-
- Click on the three dots next to the component you want to modify (Arrow 1).
- Click “Add representation” (Arrow 2) to activate the drop-down menu with available representations.
- Click the desired representation to add it to the list of representations shown with the red ellipse at the bottom of the panel.
- Use the “eye icon” to show or hide the different representations and the “trash can” icon to delete a representation (Arrow 3).
- Hide “Cartoon Representation” (Arrow 3).
-
-
Note: Depending on your screen size you may need to use the slidebar on the right (Figure 5, Arrow 4) to scroll down to view the full list of elements you can select from.
-
Change element colors (Figure 5)
- Select the component whose element color you want to modify (Step 4)
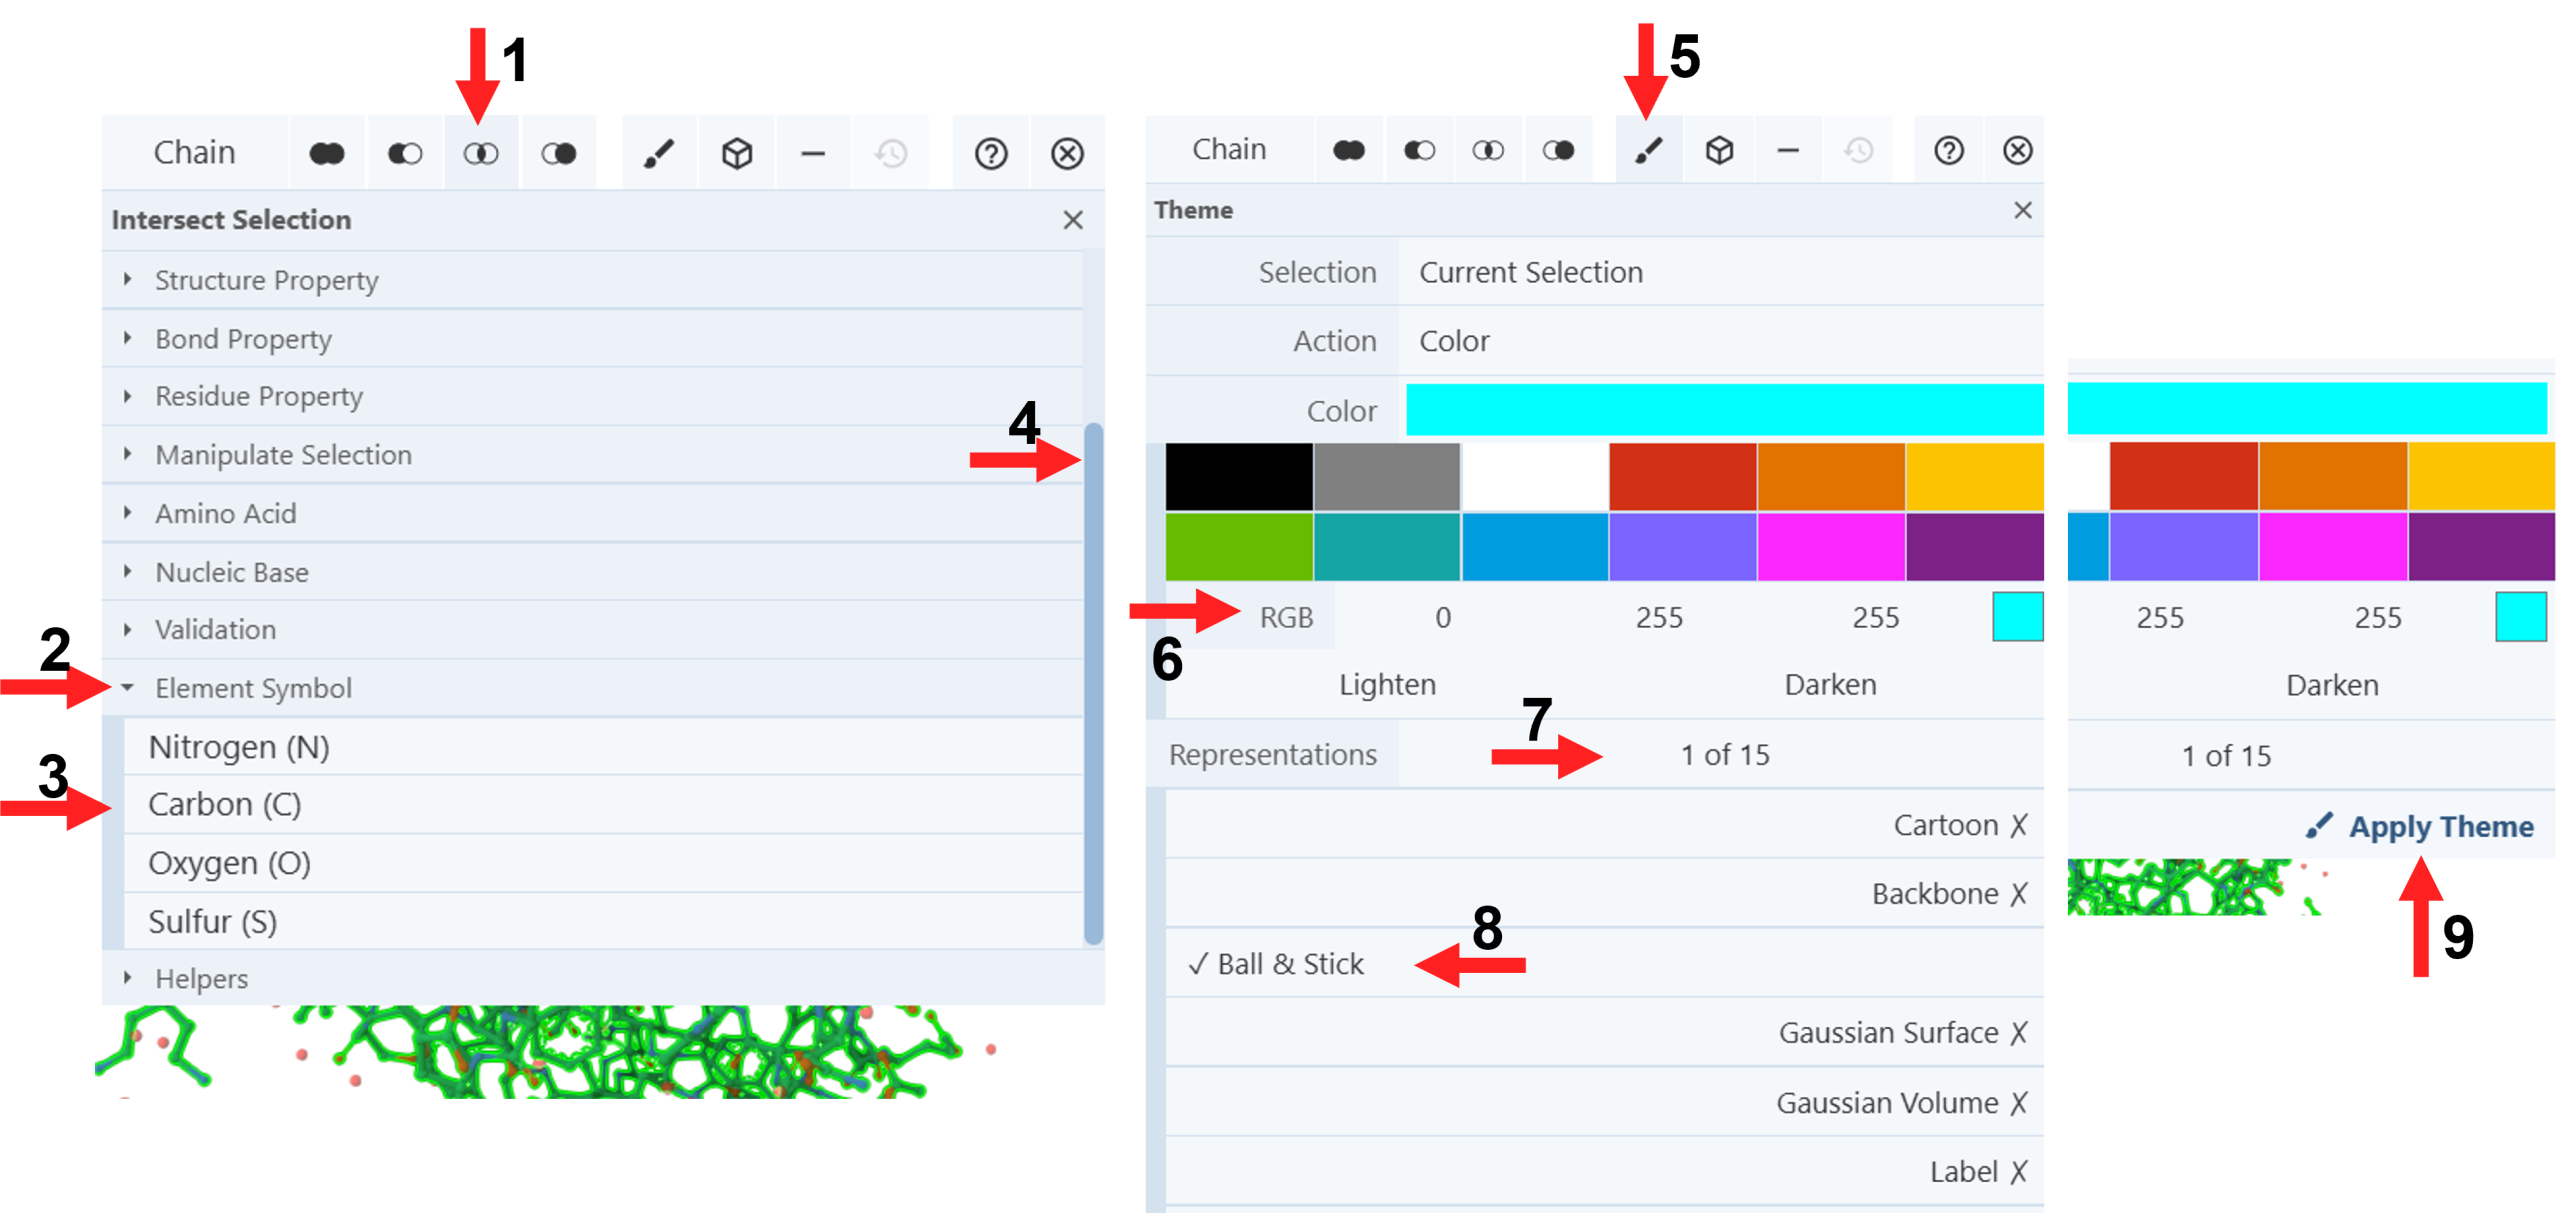
Figure 5: Selecting and coloring the element - Click “Intersect Selection” icon (Arrow 1)
- Click “element Symbol” (Arrow 2)
- Click “Carbon” (Arrow 3)
- Hide “Cartoon Representation” (Step 6d).
- Click the paint brush icon on the selection bar to open the “Theme” panel (Arrow 5).
- Click a preset color from the palette or create a new color using the RGB tool (E.g., 0, 255, 255 for cyan) (Arrow 6).
- Clicking “All” in the cell for “Representation” which will change it to “1 of 15” and open up the dropdown menu (Arrow 7).
- Click Ball & Stick (Arrow 8).
- Click “1 of 15” to collapse the menu (Arrow 7).
- Click “Apply Theme” (Arrow 9).
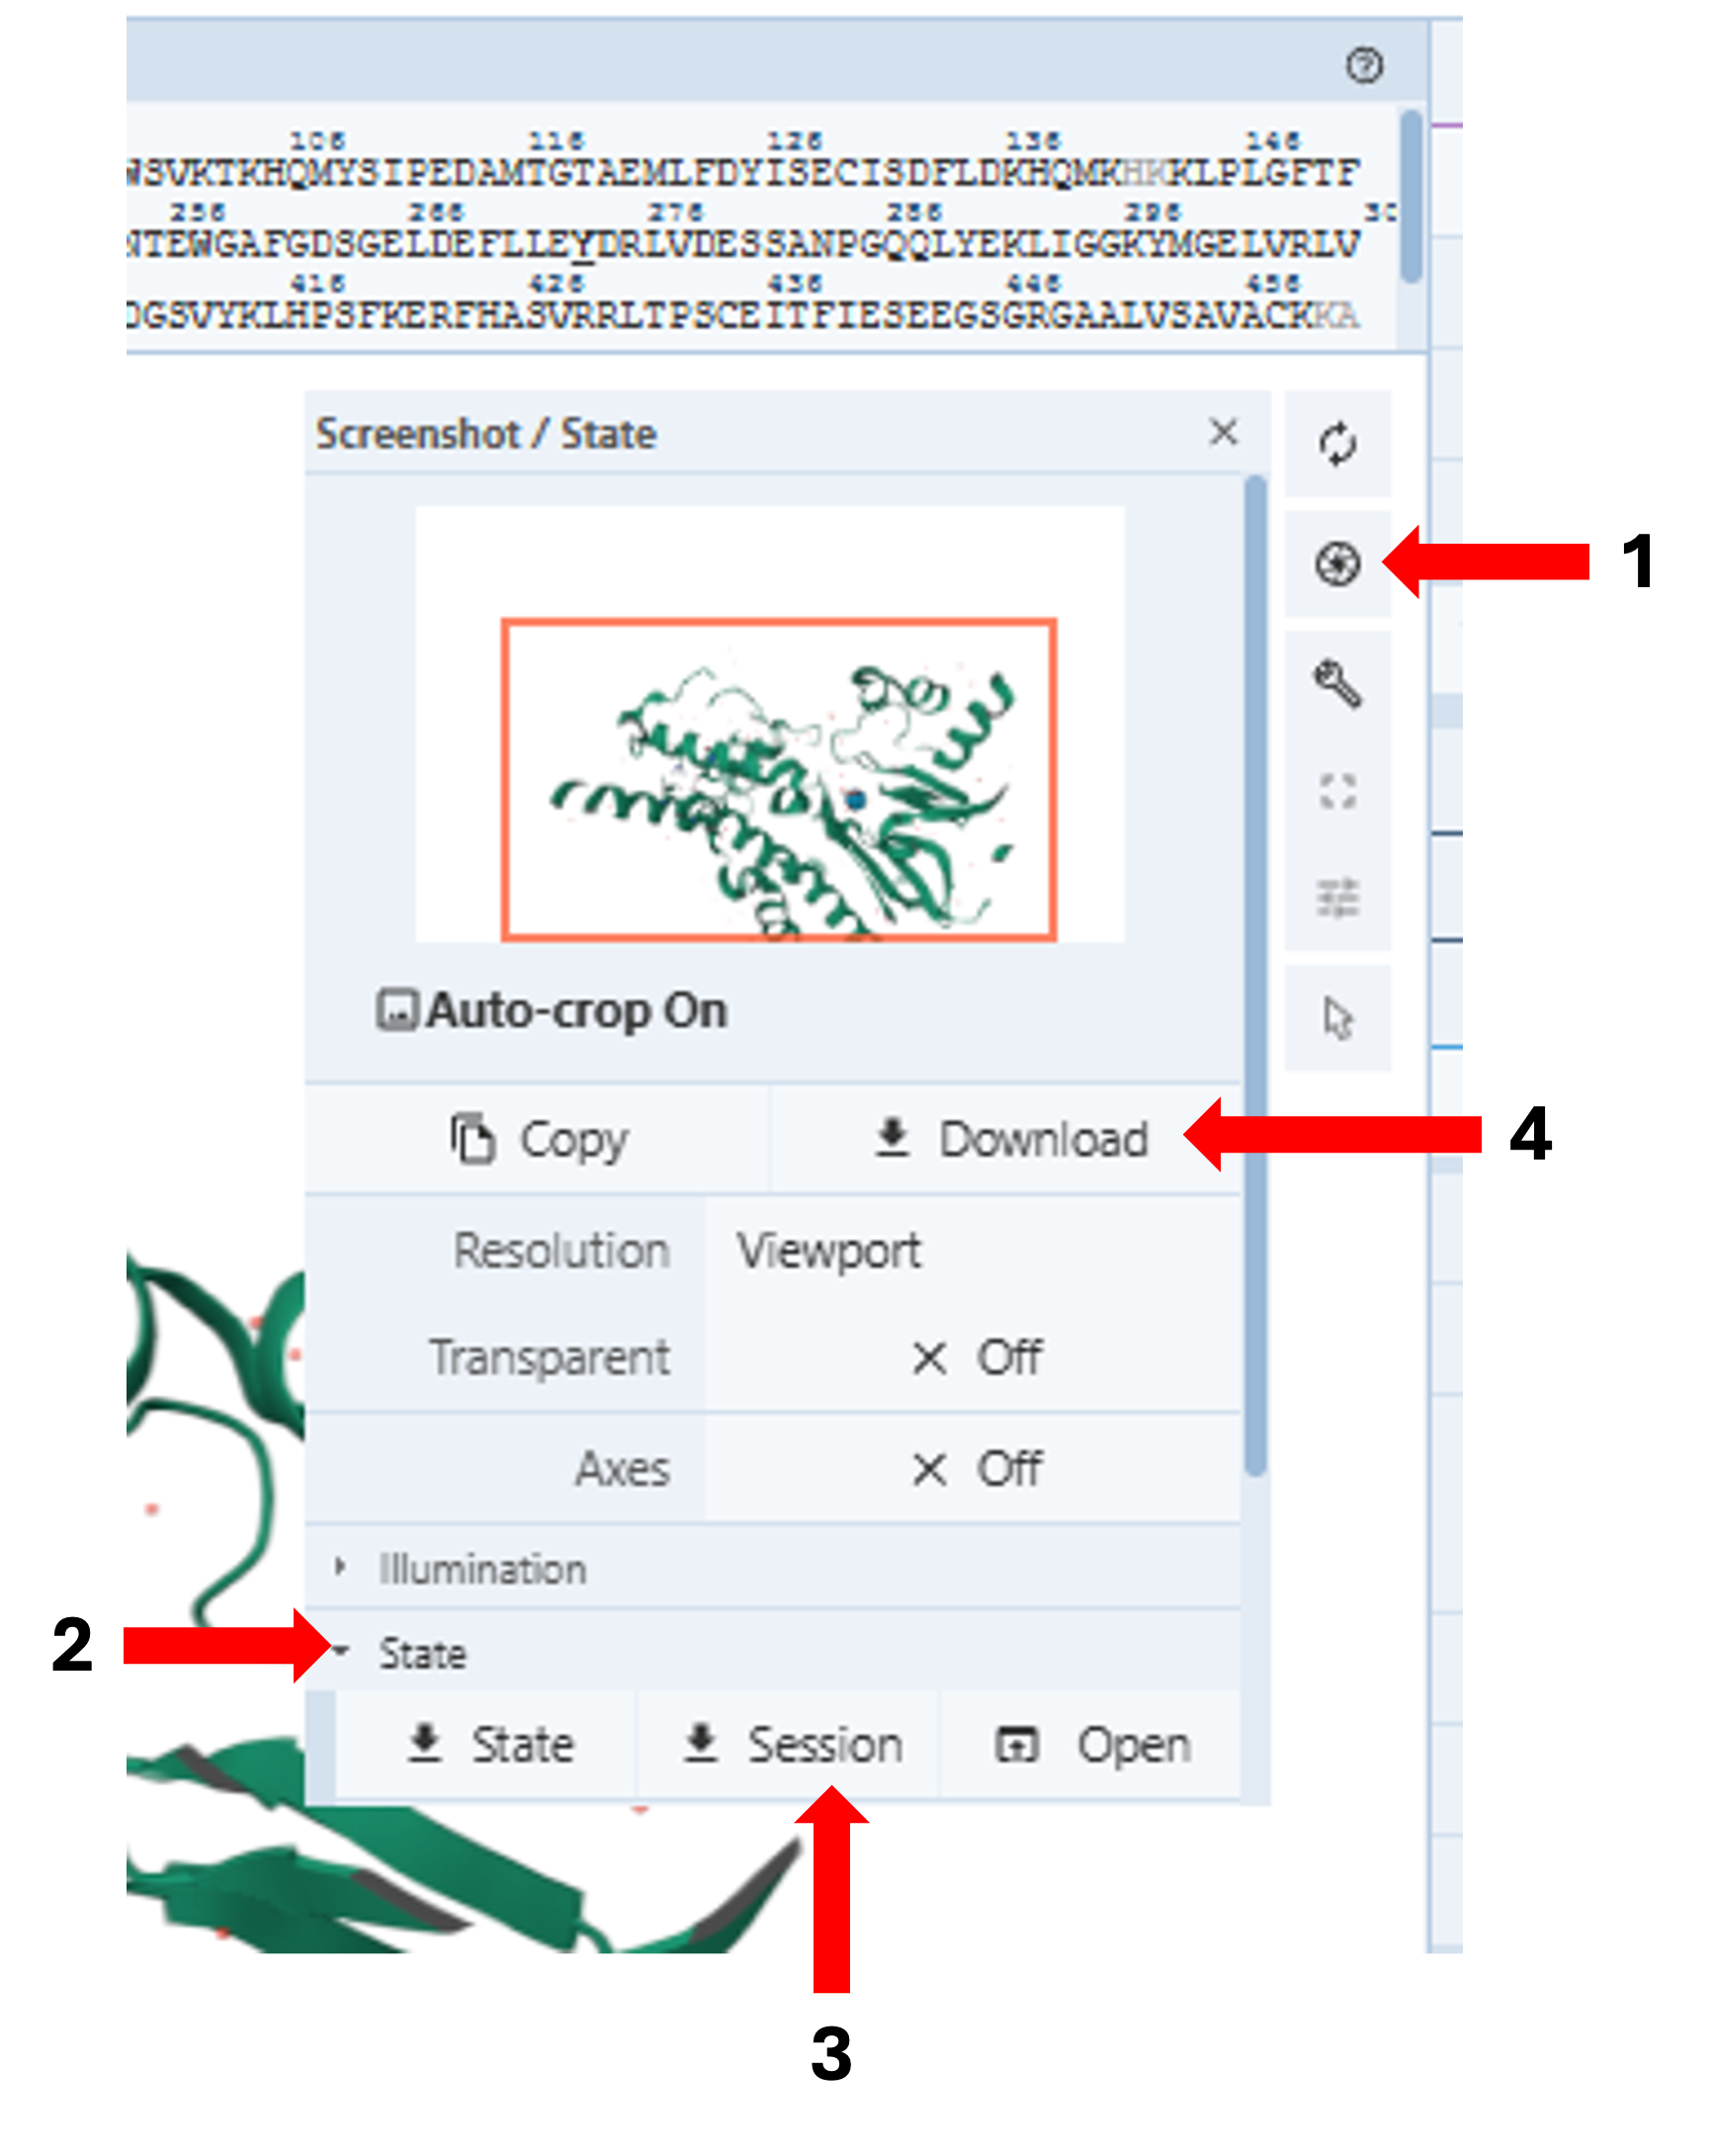
Save Files (Figure 6)
Save the file in two ways:
-
-
-
-
- Save a Mol* session file: Click the wheel icon on the toggle menu (Arrow 1), which will open a new window → Expand the “State” dropdown (Arrow 2) → Click “Session” (Arrow 3) to download the session → Save the file on your computer.
- Save a png image: Click the wheel icon on the toggle menu (Arrow 1) which will open a new window → Click “Download” (Arrow 4) to download a png file → Save the file on your computer.
-
-
-
Jump to the next Mol* tutorial: III.C. Mol* Surface Properties