
X.B. iCn3D Protein–Protein Interface
Henry V. Jakubowski and Kristen Procko
Overview: This activity demonstrates how to display interactions at the interface of two macromolecules.
Outcome: The user will be able to display contacts at the interface of two macromolecules and display the non-covalent interactions stabilizing the interface.
Time to complete: 15 minutes
Modeling Skill
- Display contacts at a protein:protein interface
About the Model
PDB ID: 6m0j
Protein: SARS-CoV-2 spike receptor-binding domain bound to the ACE2 receptor
Activity: Angiotensin-converting enzyme 2 (Chain A); Spike protein S1 (Chain B); NAG–glycan; Zn2+; Cl–
Description: Receptor for the pandemic virus, SARS-CoV-2
Steps
- Load 6M0J
a) Open iCn3D
b) In List of PDB, MMDB, or AlphaFold UniProt structures, type 6M0J
c) Click enter or “load biological unit”.
- Select ACE2 (6M0J_A) and SP1 (6M0J_E)and create a molecular surface.

Figure 1. Select protein chains to represent as a surface. Both chains must be selected.
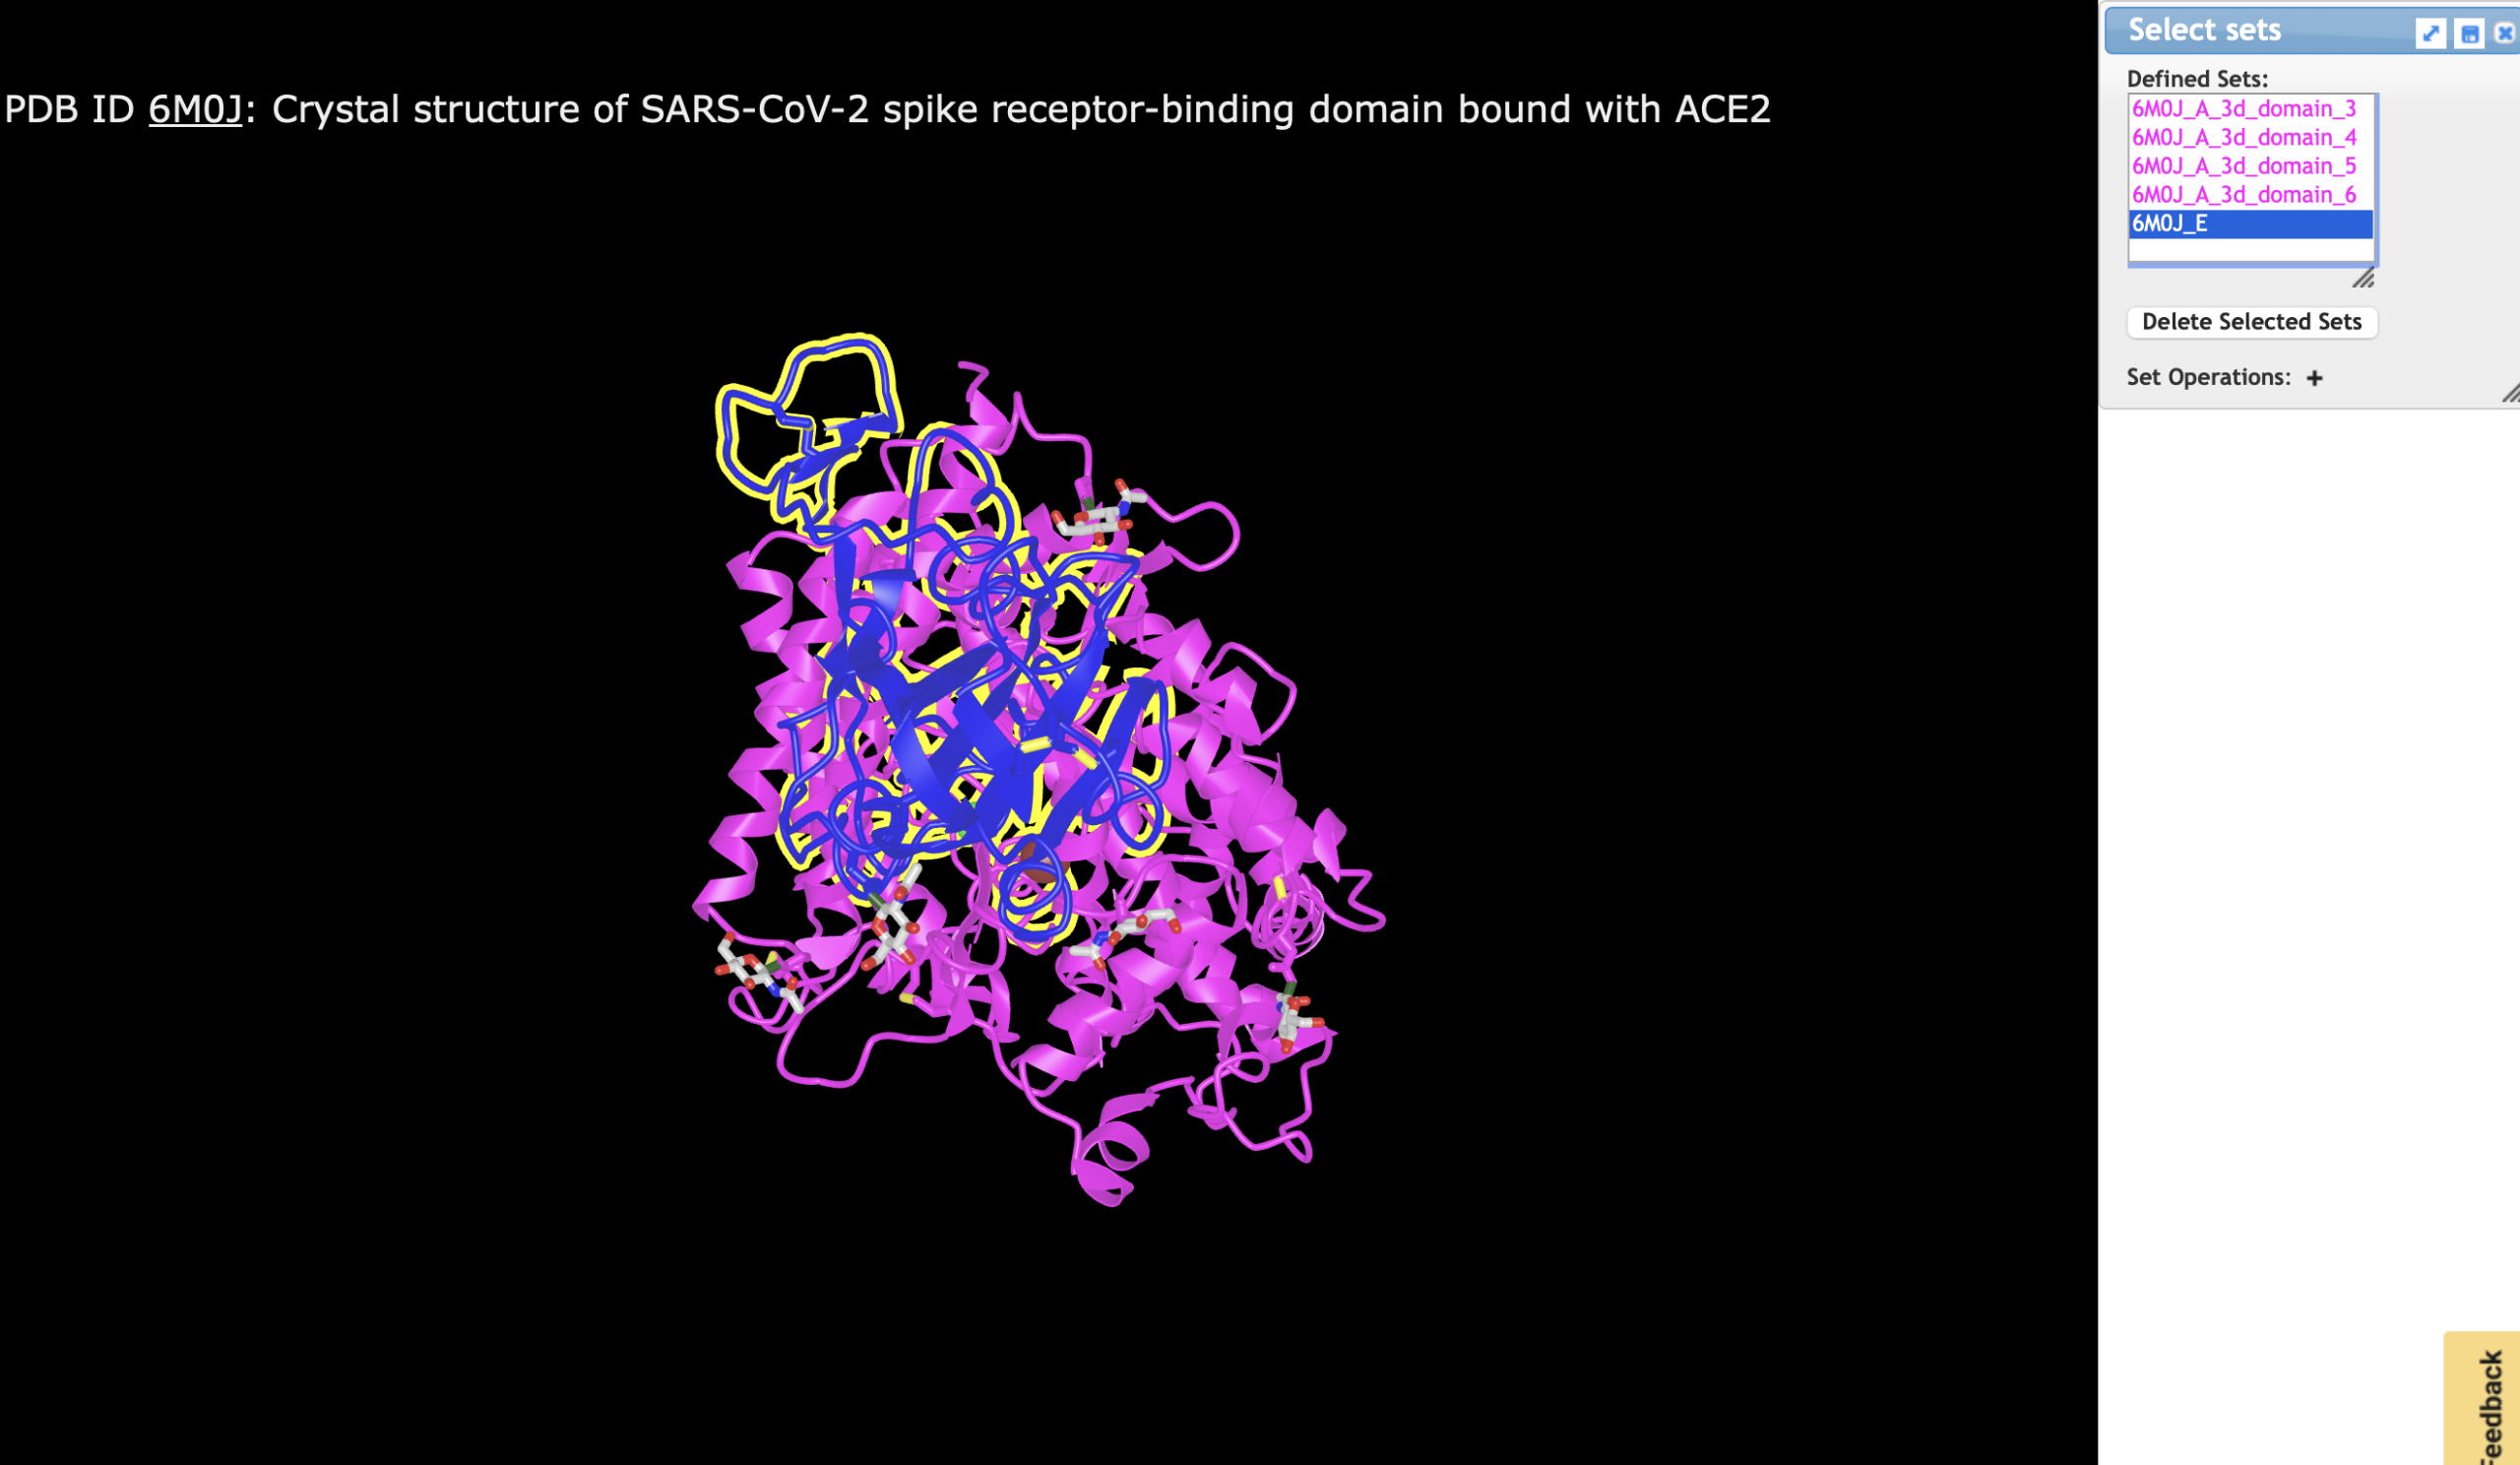
a) In the dropdown menu: Select → Defined Sets.
b) Click on 6M0J_A, then Control- or Command-Click 6M0J_E
c) From the dropdown menu: Style → Surface Opacity → Fast Opacity → 0.1 (even though it is already checked)
d) From the dropdown menu: Style → Surface Type → Molecular Surface
- Identify interactions between ACE2 and SP1
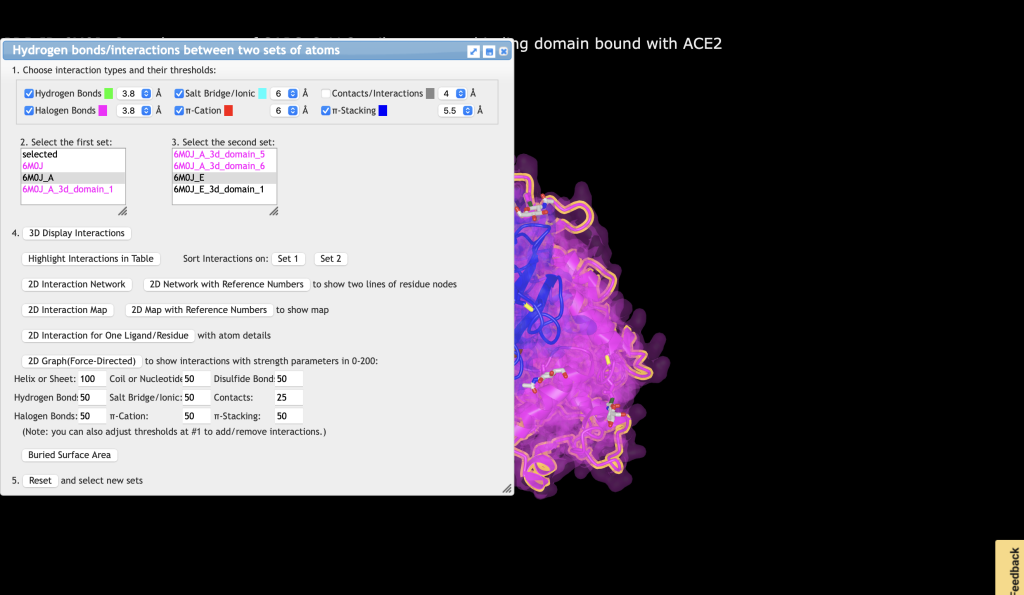
Figure 2. The Interactions analysis menu.

a) In the dropdown menu: Analysis → Interactions
b) Choose 6M0J_A for Set 1, and choose 6M0J_E for Set 2
c) Uncheck Contacts/Interactions
d) Click 3D Display Interactions
e) In the dropdown menu: Select → Save Selection
f) Type: Interactions and click Save
g) Close the Interactions window
h) In the dropdown menus: Style → side chains → stick
i) In the dropdown menus: Color → atom
- Focus on the interface
a) In the dropdown menu: View → Zoom Selection
- Label the interacting residues. In the dropdown menus:
a) Analysis → Label → Per Residue and Number
b) Analysis → Label Scale → pick a number that works for you, like 2.
- (Optional) Change the background to white. In the dropdown menus: Style → Background → White
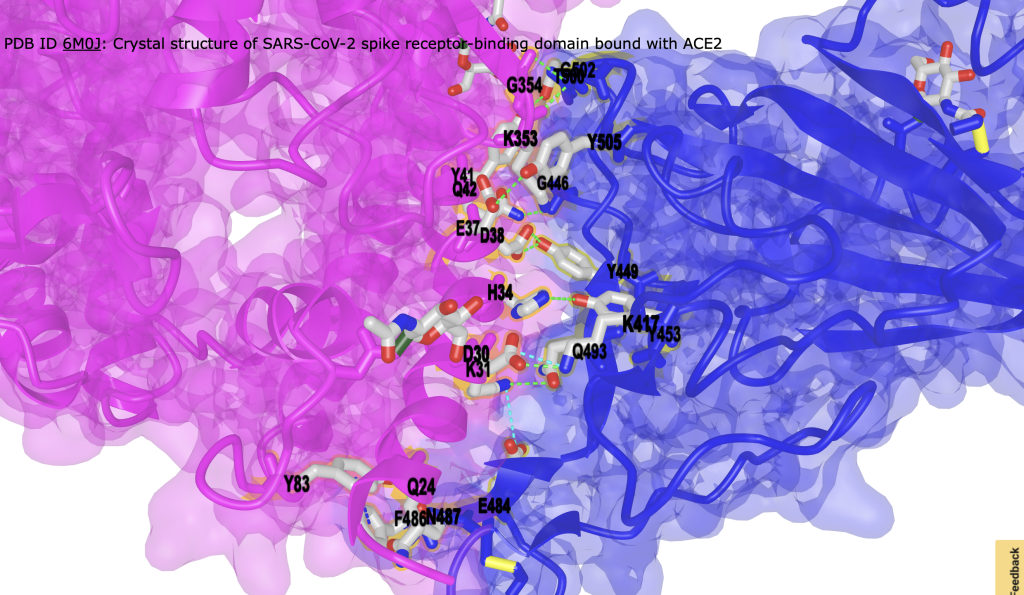
Figure 3. Interface between ACE2 and SP1. Hydrogen bonds are shown as green dashed lines; ionic interactions are shown as cyan dashed lines. Interacting residues are labeled. - (Optional) Hide surface representation to focus on interaction. Style → Remove Surface
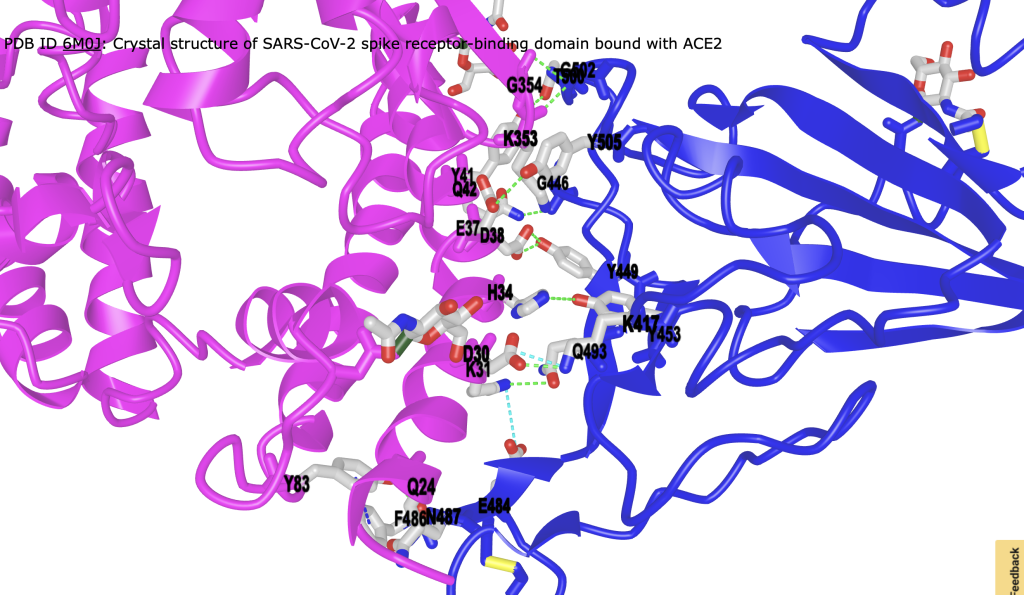
Figure 4. Alternative view of interface from Figure 3 with surface removed for clarity.


- (Optional) To measure distances between interacting residues. (For an image of this process, see: IX.B. iCn3D Manual Measurement)
a) From the dropdown menu: Analysis → Distance → between Two Atoms
b) Alt+click (PC) or Option+click (Mac) on the first atom. A square will appear around it.
c) Next, control+click on the second atom. Small rings appear surrounding the two atoms.
d) Then, in the distance measurement popup, click “display”
e) Repeat as desired
- (Optional) Save the file as a PNG or shareable link.
- See example
Note 1: Different modeling programs calculate noncovalent interactions differently using different parameters for the interactions. Hence they may show different interactions or not capture all reported ones.
Note 2: Don’t be alarmed when you see 3 green dotted lines representing H bonds between a single H bond donor (amide backbone H) and the sulfate H bond acceptors. These all meet the criteria for calculating H bonds: a slightly positive H in the backbone amide and a slightly negative O on the different oxygen atoms of the sulfate that are within 3.8 Å from the H. Also H bonds can be found between slightly positive Hs and sulfur!
Note 3: Once you run interactions, iCn3D adds many new additions to the Defined sets window. Explore these to learn and perhaps better ways to explore the interactions.
Jump to the next iCn3D tutorial: XI.B. iCn3D Superimposition