
IV.B. iCn3D Viewing Biological vs. Asymmetric Units
Ning Sui
Overview: The activity in this chapter demonstrates different ways to display structures (e.g., biological vs. asymmetric units).
Outcome: The user will explore different tools to load/display information related to biological/asymmetric units.
Time to complete: 10 minutes
Modeling Skill
- Display biological vs. asymmetric units
About the Model
PDB ID: 1hho
Protein: Oxy-hemoglobin
Activity: gas transport in red blood cells
Description: tetramer, bound heme prosthetic group with bound oxygen, phosphate ligand
Background
The asymmetric unit can represent either: (a) the complete biological unit (i.e., the biochemically active form of a biomolecule); (b) a portion of the biological unit; or (c) multiple copies of the biological unit. The “asymmetric unit” is equivalent to the biological unit (correct oligomeric functional state) in approximately 60% of structure records. The RCSB PDB has a detailed page explaining the asymmetric unit, with examples.
iCn3D can load structures using different unique identifiers (UID), such as PDB ID (e.g., 1hho) and MMDB ID (e.g., 1183). It also supports local file uploads, including .pdb and .cif formats, via the dropdown menu: File → Open
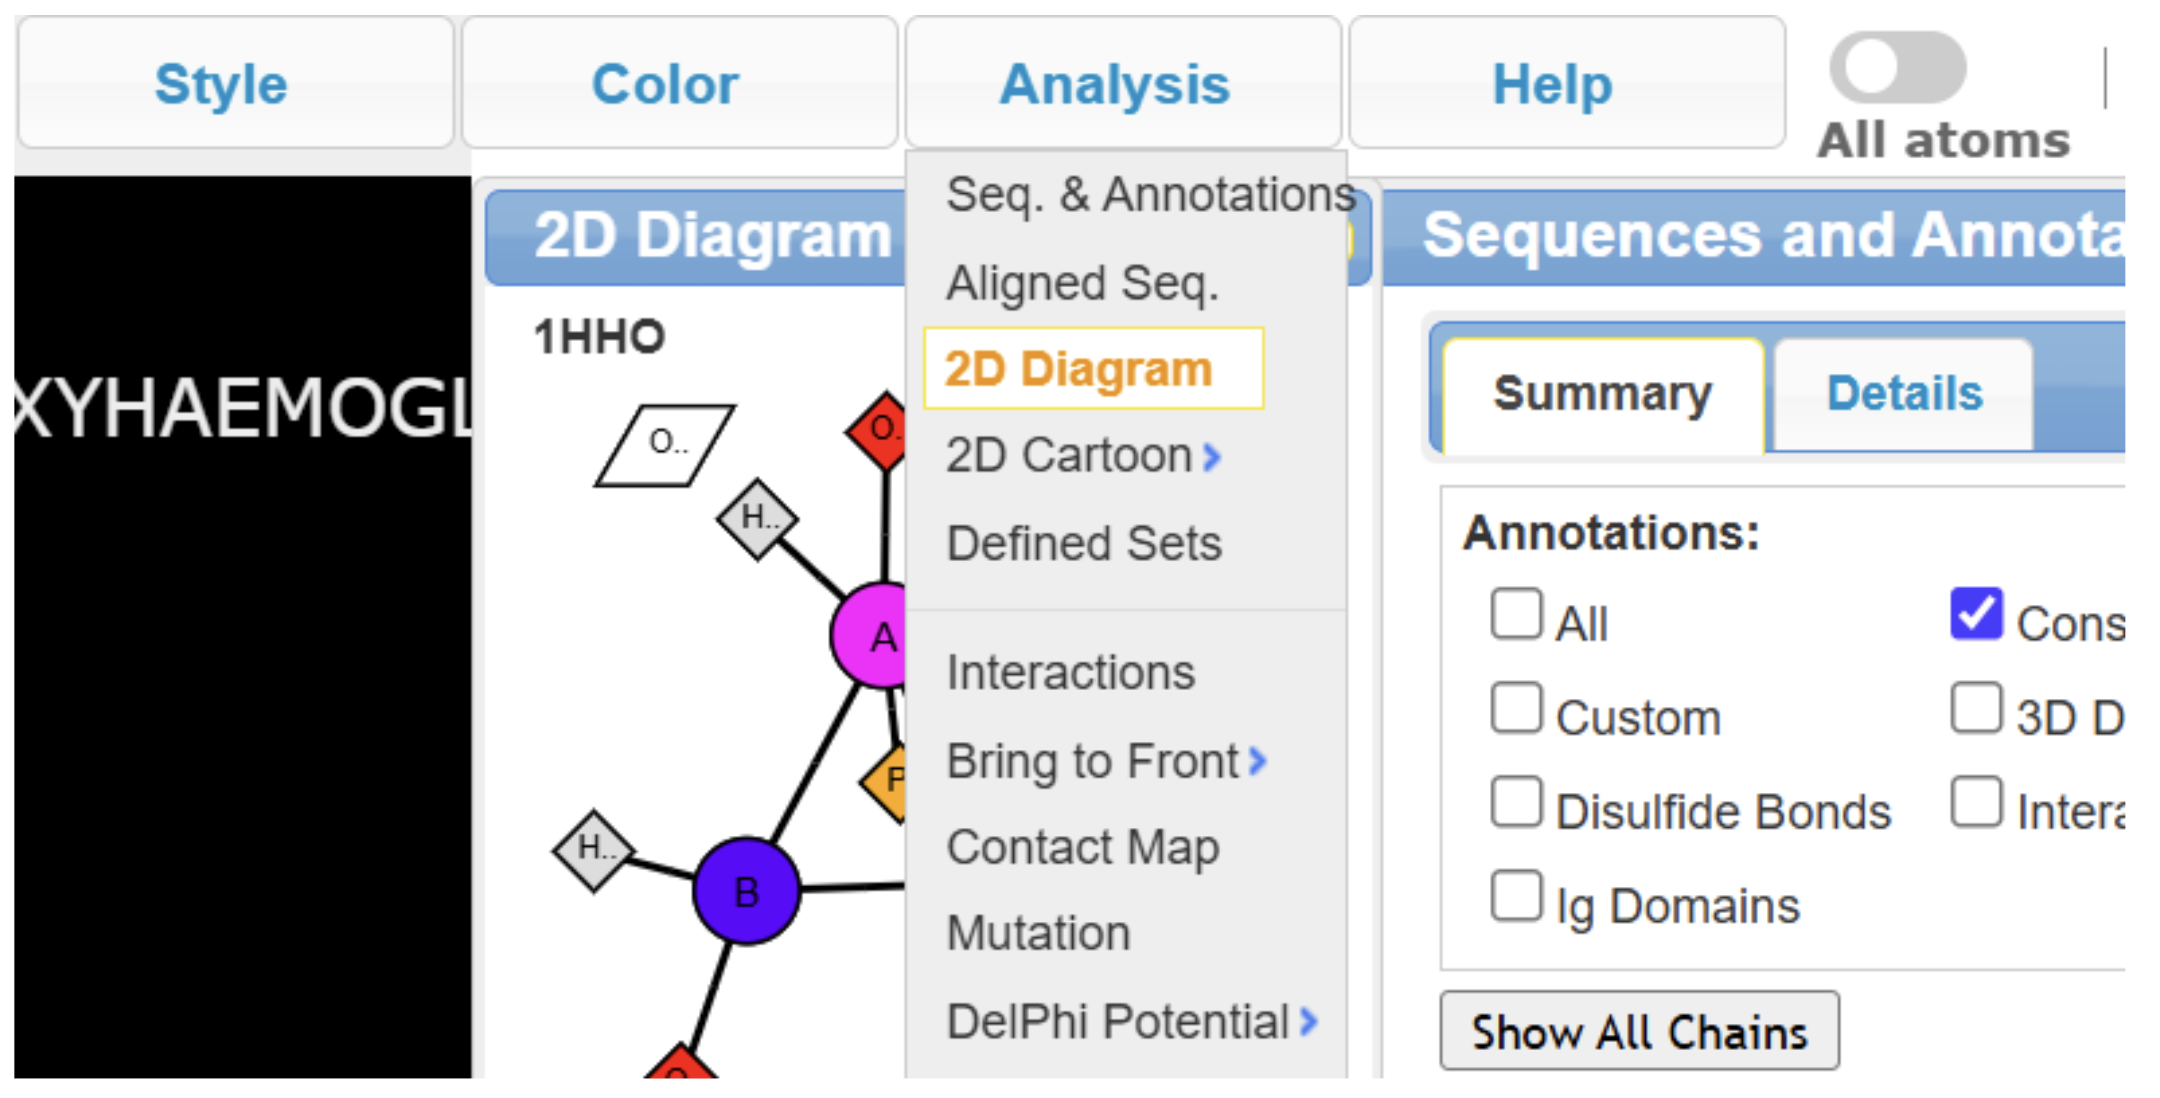
MMDB IDs are numerical identifiers from NCBI’s Molecular Modeling Database, which typically displays the biological unit — the functionally relevant oligomeric form of the molecule. These records may also include a 2D interactions schematic showing molecular components and their contacts. Historically, this schematic was limited to MMDB-based loads, it is now generally available in iCn3D regardless of how the structure is imported (via PDB ID or MMDB ID), as long as interaction data exists. It does not automatically display though, and can be accessed via the dropdown menu: Analysis → Seq. & Annotations, and Analysis → 2D Diagram (as shown in Figure 1). Here is an annotated illustration of 1hho (human oxyhemoglobin) with the interactions schematic.
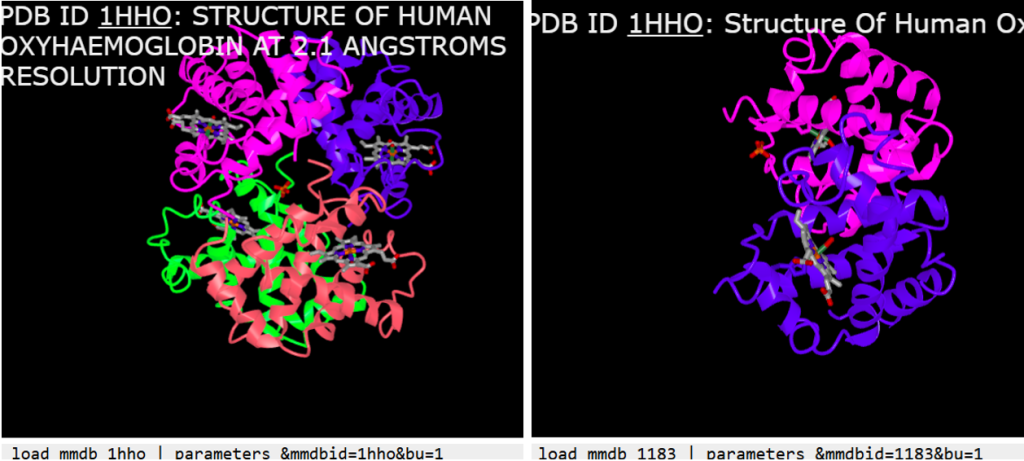
Note: While many PDB entries have corresponding MMDB records, not all do, and some MMDB entries may be outdated or incomplete. For example, loading 1hho by PDB ID currently displays the full tetrameric hemoglobin, whereas the corresponding MMDB entry (1183) shows only an αβ dimer, likely due to legacy data that has not been updated (Figure 2).
Membrane Display in iCn3D
iCn3D will display membranes for transmembrane proteins using orientation data from the Orientations of Proteins in Membranes (OPM) database. OPM provides a biologically relevant positioning of the protein within a membrane but does not alter the structure itself.
The UID entered for OPM loads is the same PDB ID (e.g., 6jxr) — OPM does not assign a separate identifier. As an example, see the iCn3D display for 6jxr (structural basis of assembly of the human T cell receptor-CD3 complex). This is a feature unique to iCn3D as a web browser-based visualization tool, and Mol* currently does not have this capability.
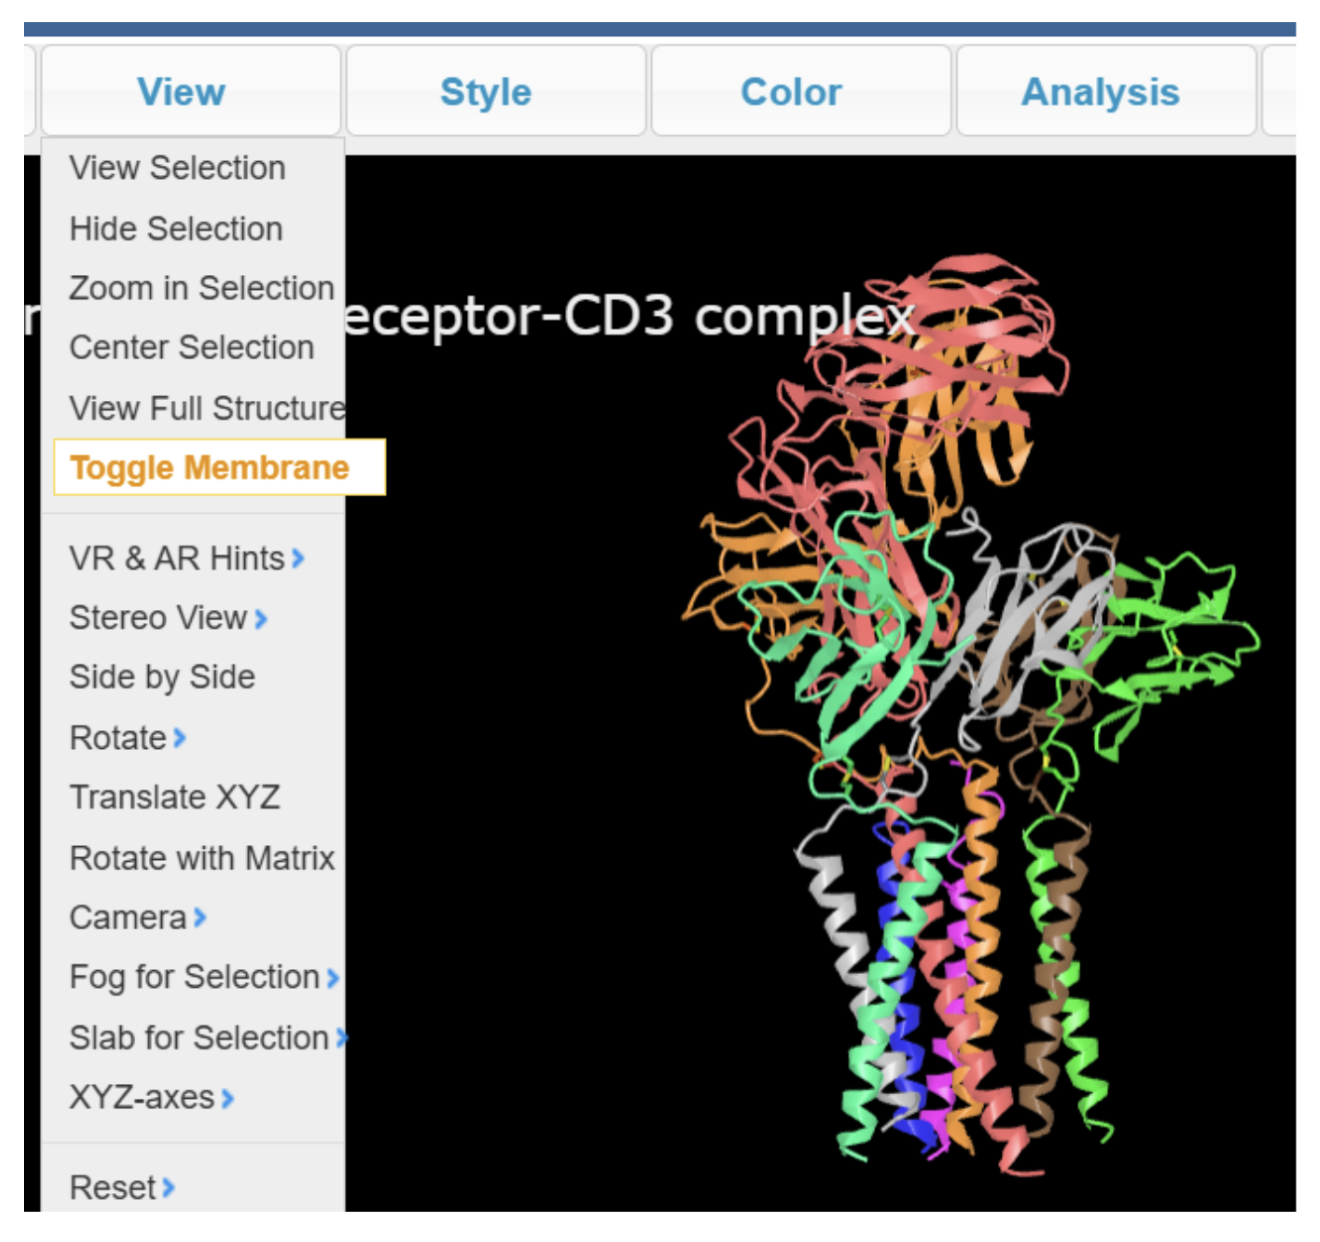
Historically, structures loaded by PDB ID or MMDB ID did not include membrane orientation. Users had to explicitly choose File → Retrieve by ID → OPM PDB ID to load the OPM-aligned version of a structure. However, in current versions of iCn3D, if OPM data is available for a given PDB ID, the membrane plane is now automatically displayed, even when the structure is loaded by PDB ID or MMDB ID. Membrane display can be turned on or off via View → Toggle Membrane (Figure 3).
Going Deeper
About the Model
PDB ID: 4iaq (special to iCn3D, you may compare loading it in Mol*)
Protein: Serotonin or 5-hydroxytryptamine (5-HT) receptor
Activity: G protein-coupled receptor (GPCR) involved in neurotransmission and signal transduction
Description: chimeric protein of 5-HT1B-BRIL in complex with dihydroergotamine
Steps
- Open iCn3D in your web browser.
-
(Optional) Use the dropdown menu in the top left corner to view All Menus instead of Simple Menus. Note that the full menu has more functionalities, while for this activity, in the new version of iCn3D, the simple menu suffices as well.
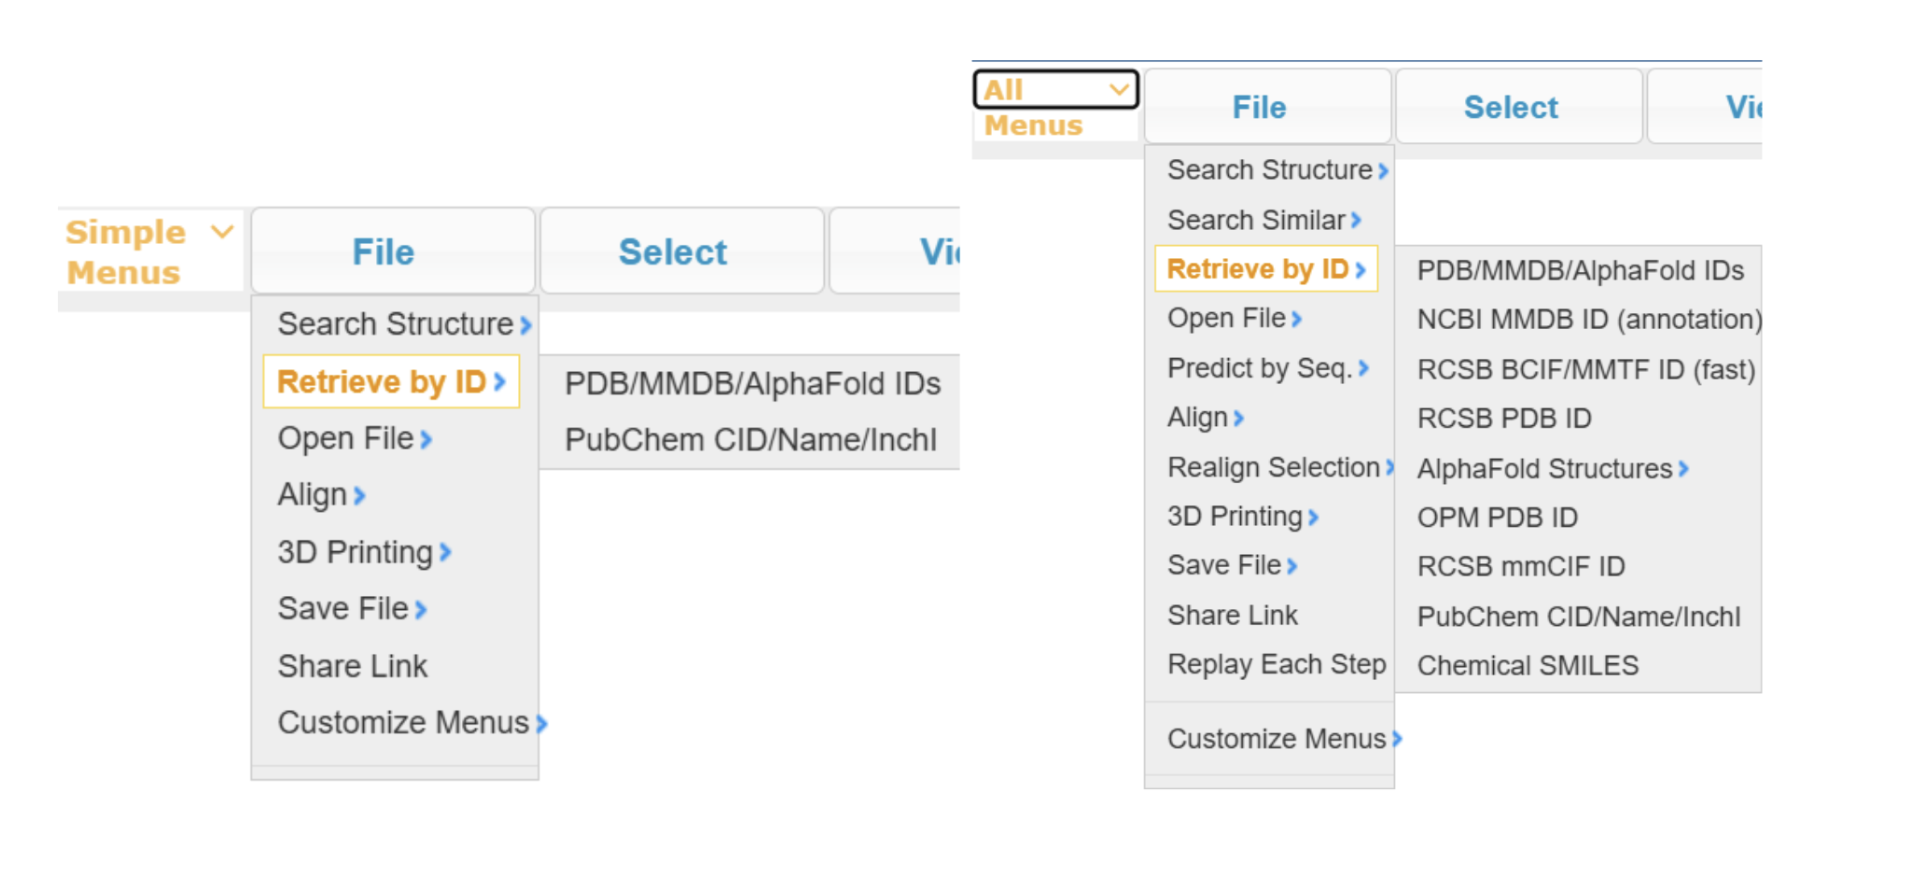
- Type 4iaq directly into the popup window, or use the dropdown menu: File → Retrieve by ID → PDB/MMDB/Alphafold IDs
- Try “Load Biological Unit” (or directly press Enter), v.s. “Load Asymmetric Unit”, and compare the difference.
- In the Biological Unit view, toggle the membrane to show or hide the membrane (Figure 3).
View → Toggle Membrane
- View the annotations and 2D interactions schematic via Analysis → Seq. & Annotations, and Analysis → 2D Diagram.
Jump to the next iCn3D tutorial: V.B. iCn3D Mouse/Trackpad Selection