
III.B. iCn3D Molecular Surface/Properties
Henry V. Jakubowski and Kristen Procko
Overview: This chapter describes the application of coloring to help display molecular properties.
Outcome: The user will be able to display the molecular surface of a structure, apply a chemical property-based coloring scheme, and change transparency.
Time to complete: 10 minutes
Modeling Skills
- Display the Molecular Surface of Protein
- Molecular with different colors
- Electrostatic Potential
- Hydrophobicity
About the Model
PDB ID: 1XWW
Protein: Low molecular weight protein tyrosine phosphatase
Activity: hydrolyzes Tyr-OPO32- phosphoester bond
Description: single chain, bound SO42- competitive inhibitor, bound glycerol (nonspecific stabilizer)
Steps
Preparing the model to show surface renderings
- Load 1xww
a) Navigate to: iCn3D
b) Type: 1XWW in the popup
c) Click “load biological unit”
- Color the protein by secondary structure. In the dropdown menu: Color → Secondary → Sheets in Yellow
- Change the background canvas to white. In the dropdown menu: Style → Background → White
Applying a semi-transparent molecular surface
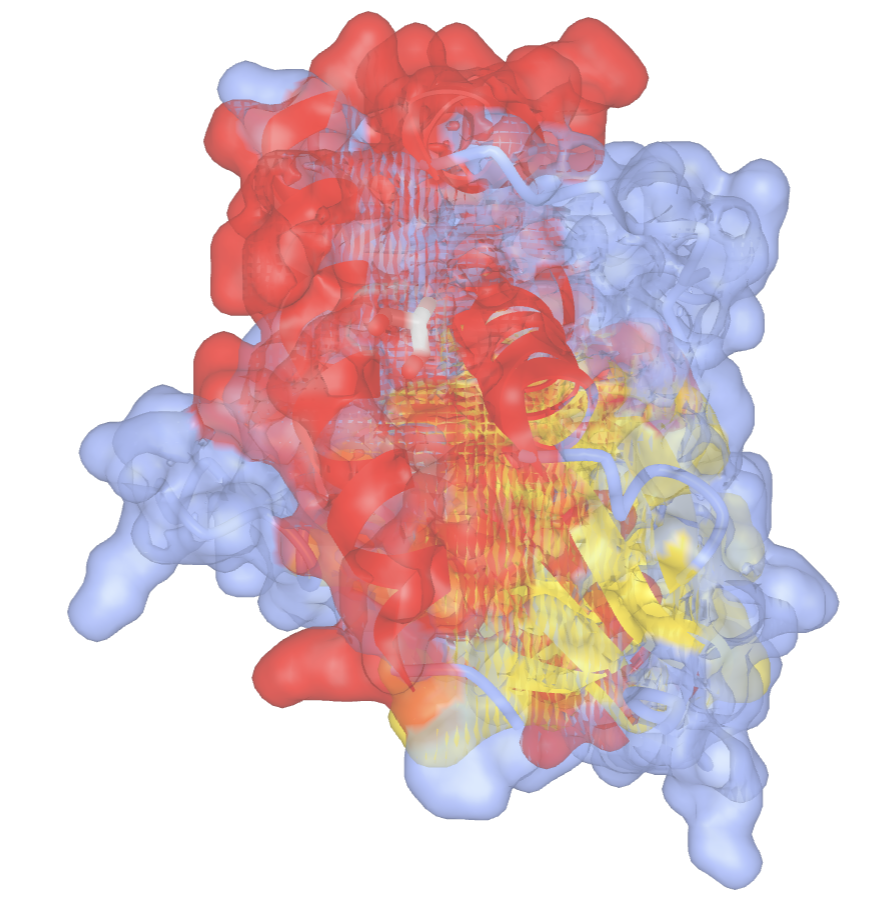
- Set the transparency for the surface rendering before you apply it. In the dropdown menu: Style → Surface Opacity → 0.5
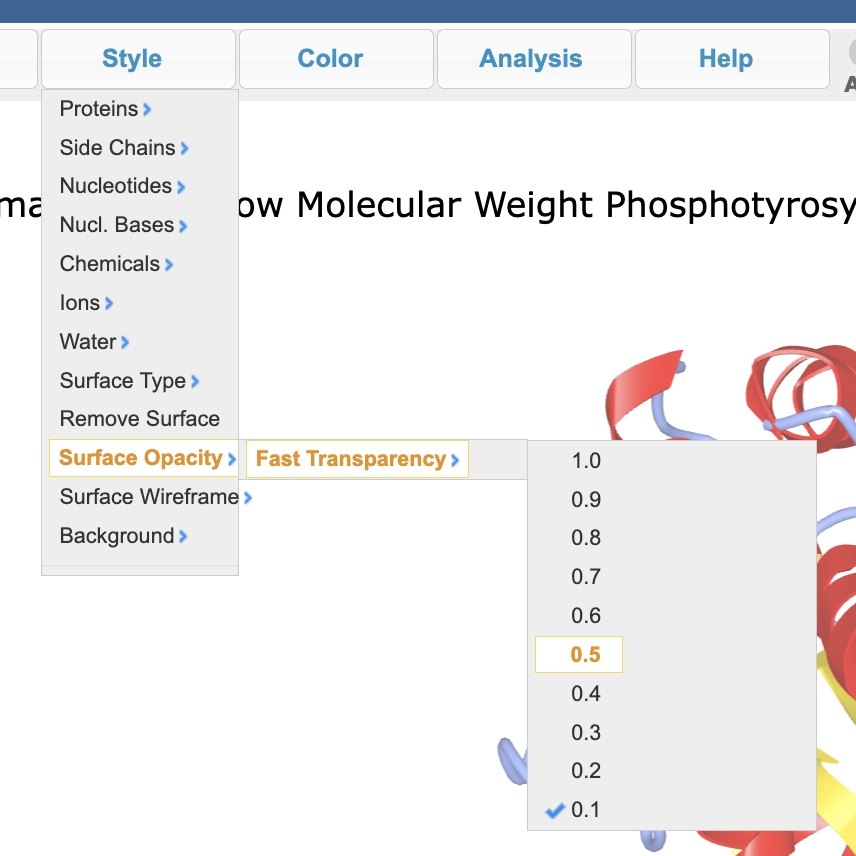
- Add a surface rendering. In the dropdown menu: Style → Surface Type → Molecular (takes a while to render)
- Remove the surface rendering. In the dropdown menu: Style → Remove Surface
Note: If you reverse steps 4 and 5, the surface will not adopt the transparency setting. In that case, remove the transparency (step 6), apply the desired transparency, then show the surface.
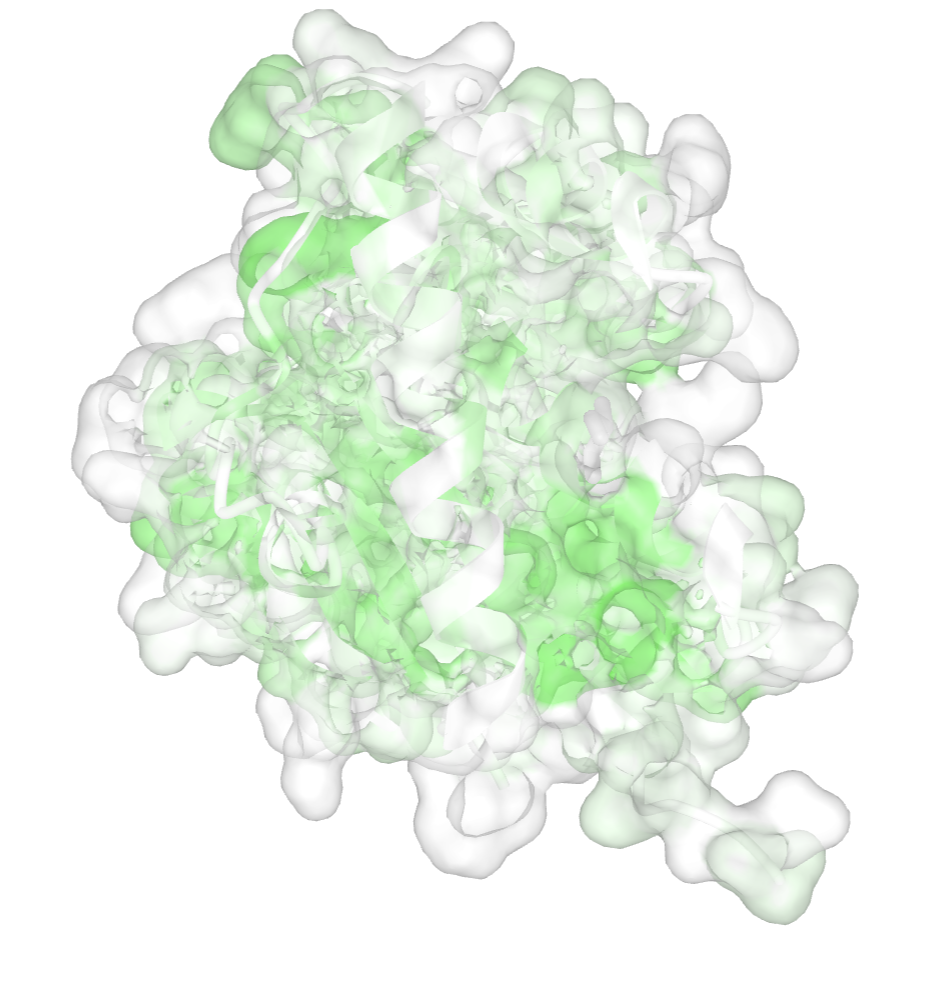
Applying a hydrophobic surface rendering
- Color the surface to show hydrophobicity. In the dropdown menu: Color → Hydrophobicity → Normalized
- Apply the surface rendering. In the dropdown menu: Style → Surface Type → Molecular
- Remove the surface rendering. In the dropdown menu: Style → Remove Surface
Applying an electrostatic surface rendering
- Color the protein to show electrostatic (charge) distribution. In the dropdown menu: Color → Charge
- Apply the surface rendering. In the dropdown menu: Style → Surface Type → Molecular
- Remove the surface rendering. In the dropdown menu: Style → Remove Surface
Applying the DelPhi potential electrostatic surface rendering
- Apply the DelPhi potential. In the dropdown menu: Analysis → DelPhi Potential,
- In the popup window, click: Surface with Potential Tab
- Then, select the “Surface with Potential” box
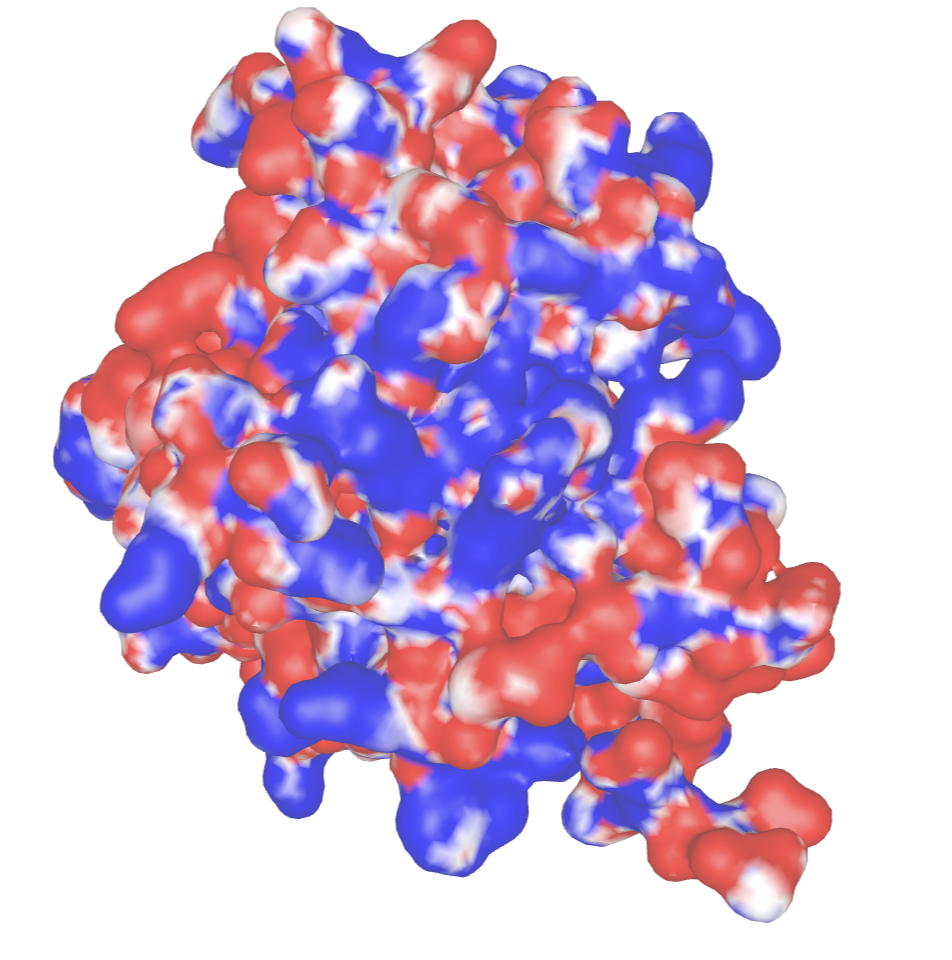
Electrostatic surface potentials shows the charge distributions of molecules based on the attractive or repulsive forces felt by a fixed charged at a distance from the molecule. They are usually color-coded with regions enriched in eletrons shown in red and deficient in electrons in blue. A great example to show this is for superoxide dismutase (2SOD), whose surface potential helps attract the toxic superoxide (O2– free radical into the active site).
Jump to the next iCn3D tutorial: IV.B. iCn3D Loading Structures