
7. Evaluating Structure Quality
Kristin Fox
Evaluation of the Quality of Experimentally-Determined Structures
The RCSB provides detailed structure validation reports for all experimentally-determined structures in the Protein Data Bank. They can be viewed by going to the RCSB and opening the PDB entry page for the structure (see the chapter on A Guide to PDB Structures). The Slider Graphic (Figure 1) is visible at the top, right of the page for each PDB entry. To access the structure validation report, click on the Full Report button above the Slider Graphic. There are different types of validation reports for structures determined by the major experimental methods (x-ray crystallography, NMR, electron microscopy). The RCSB also provides a FAQ page for these reports.
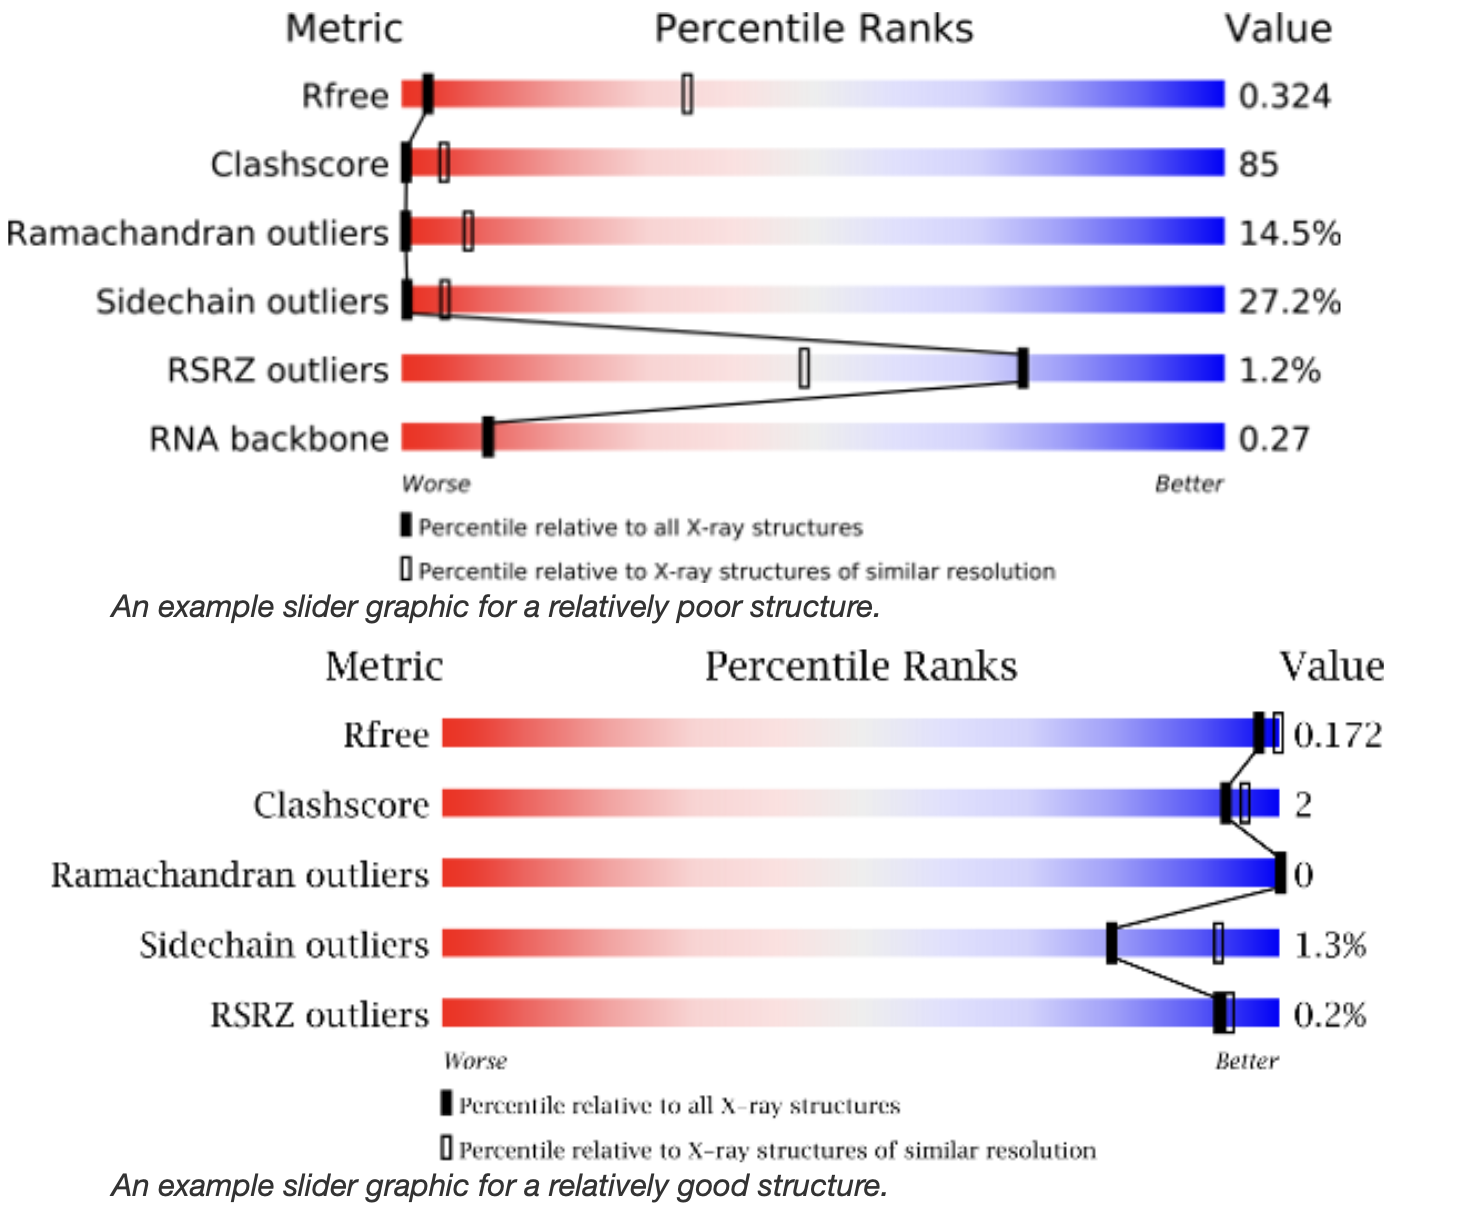
For all structures, the overall quality of the structural model can be evaluated by looking at the Slider Graphic (Figure 1). A black bar (slider) in the blue area to the right indicates a “better” structure while one in the red area to the left indicates a “worse” structure. If all the sliders are in the blue range the overall structure is reliable.
If the sliders are not all in the blue area it is worth investigating the validation report more closely to understand why this is the case. In some cases the structure is not well-determined, but for others there may be a good reason for a low score from a particular metric. For a detailed description of the metrics in the slider graphic see the validation report pages for x-ray crystallography , NMR, or EM .
While the slider graphic provides information about the overall quality of a structure, the quality of a structure is not the same from the N-terminus to the C-terminus. In the process of fitting a structural model to the data, some regions of the structure end up being of higher quality than others. To more thoroughly understand how well-determined the structure is in a particular region of the macromolecule you can look at the Quality of Chain table in the Full Report (Figure 2).
In this table each line is one chain (subunit) of the structure. It is important to realize that the parts of the structure shown in gray are amino acid residues that are present in the protein or nucleic acid sample but not present in the structure. Green indicates regions of high quality. Yellow, orange, and red indicate increasing numbers of outliers for one or more of the quality metrics in that region of the structure. The percentage of outliers in each region of the chain is indicated by the numbers under each colored bar.
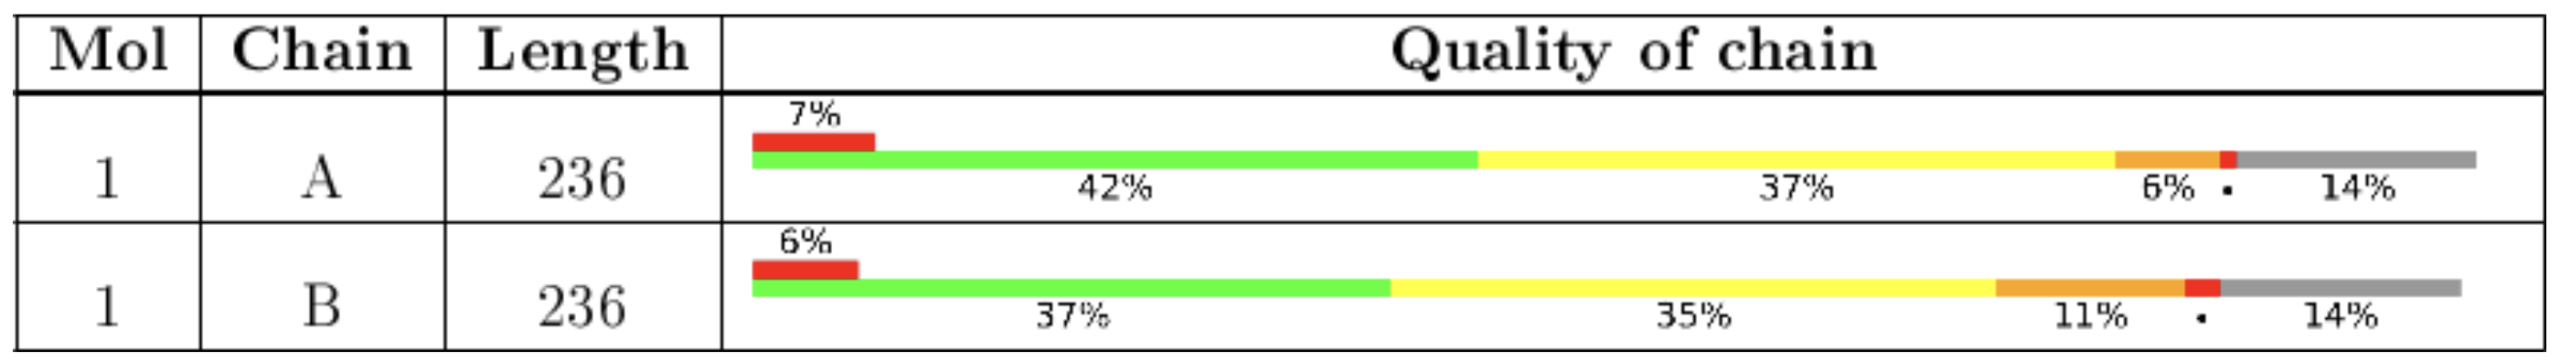
For example: In the structure analyzed in the Quality of Chain table in Figure 2, the N-terminal region is well-determined (green), while toward the middle it is less well-determined (yellow and orange), and at the C-terminus there is a stretch of residues that would show up in the sequence but are not present in the structure at all (gray). In this case the structure would not be useful if you were studying something about a region near the C-terminus and it would be best to find a different structure. To learn how to search for structures of a protein with particular characteristics see the Chapter on Advanced PDB Search.
For more granular detail examine the Residue-Property Plot in the Full Report (Figure 3). In this representation each amino acid residue is colored according to its structure quality using the same color scheme discussed above. This allows you to evaluate individual residues in the structure. Residues with red shapes above them have side chains that don’t fit the data well.
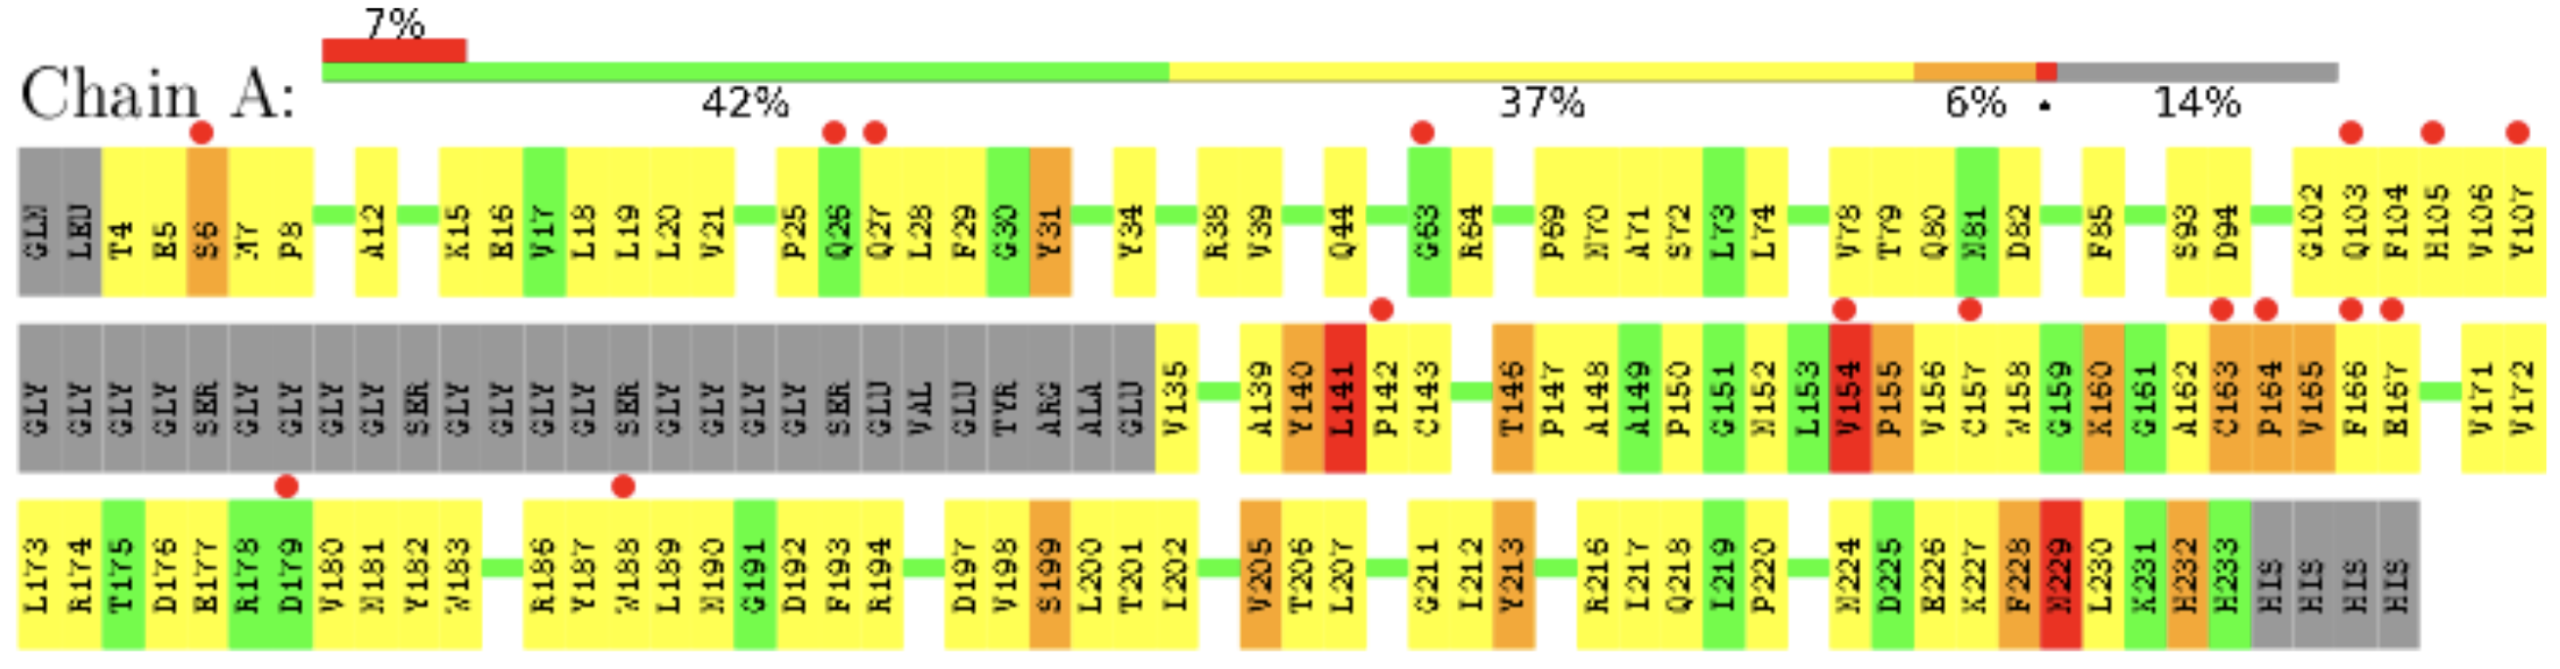
For example: In the structure analyzed in Figure 3, the sequence from residue 108-134 is shown in gray, meaning that these residues do not appear in the structure at all. There are also 3 amino acids shown in red that have poorly determined side chain structures and 16 residues with red circles above them that have side chains that don’t fit the data well. In this case it would be important to be careful about drawing conclusions from the positions of the side chains of the residues shown in red or with red circles above them as they are likely not very reliable. However the structures of the side chains of the residues shown in yellow and green are likely reliable.
One other thing you may find is that an amino acid residue may appear in a structure, but some of its side chain atoms may be missing. This indicates that the data were not clear enough to correctly place those atoms. As a result it is not possible to know the positions of these side chain atoms. You can see this by viewing the PDB file in a molecular structure viewer (see Chapter I for getting started with molecular structure viewers), turning on the side chains, and checking to be sure that all the atoms that are expected to be present are part of the model.
Evaluation of the Quality of Computed Structural Models
The RCSB recommends that whenever an experimentally-determined structure of a macromolecule is available, it should be used instead of the computed structural model (CSM). However, a CSM is a very useful tool when an experimentally-determined structure is not available for particular macromolecule or macromolecular complex. More information is available from the PDB 101 chapter on CSMs.
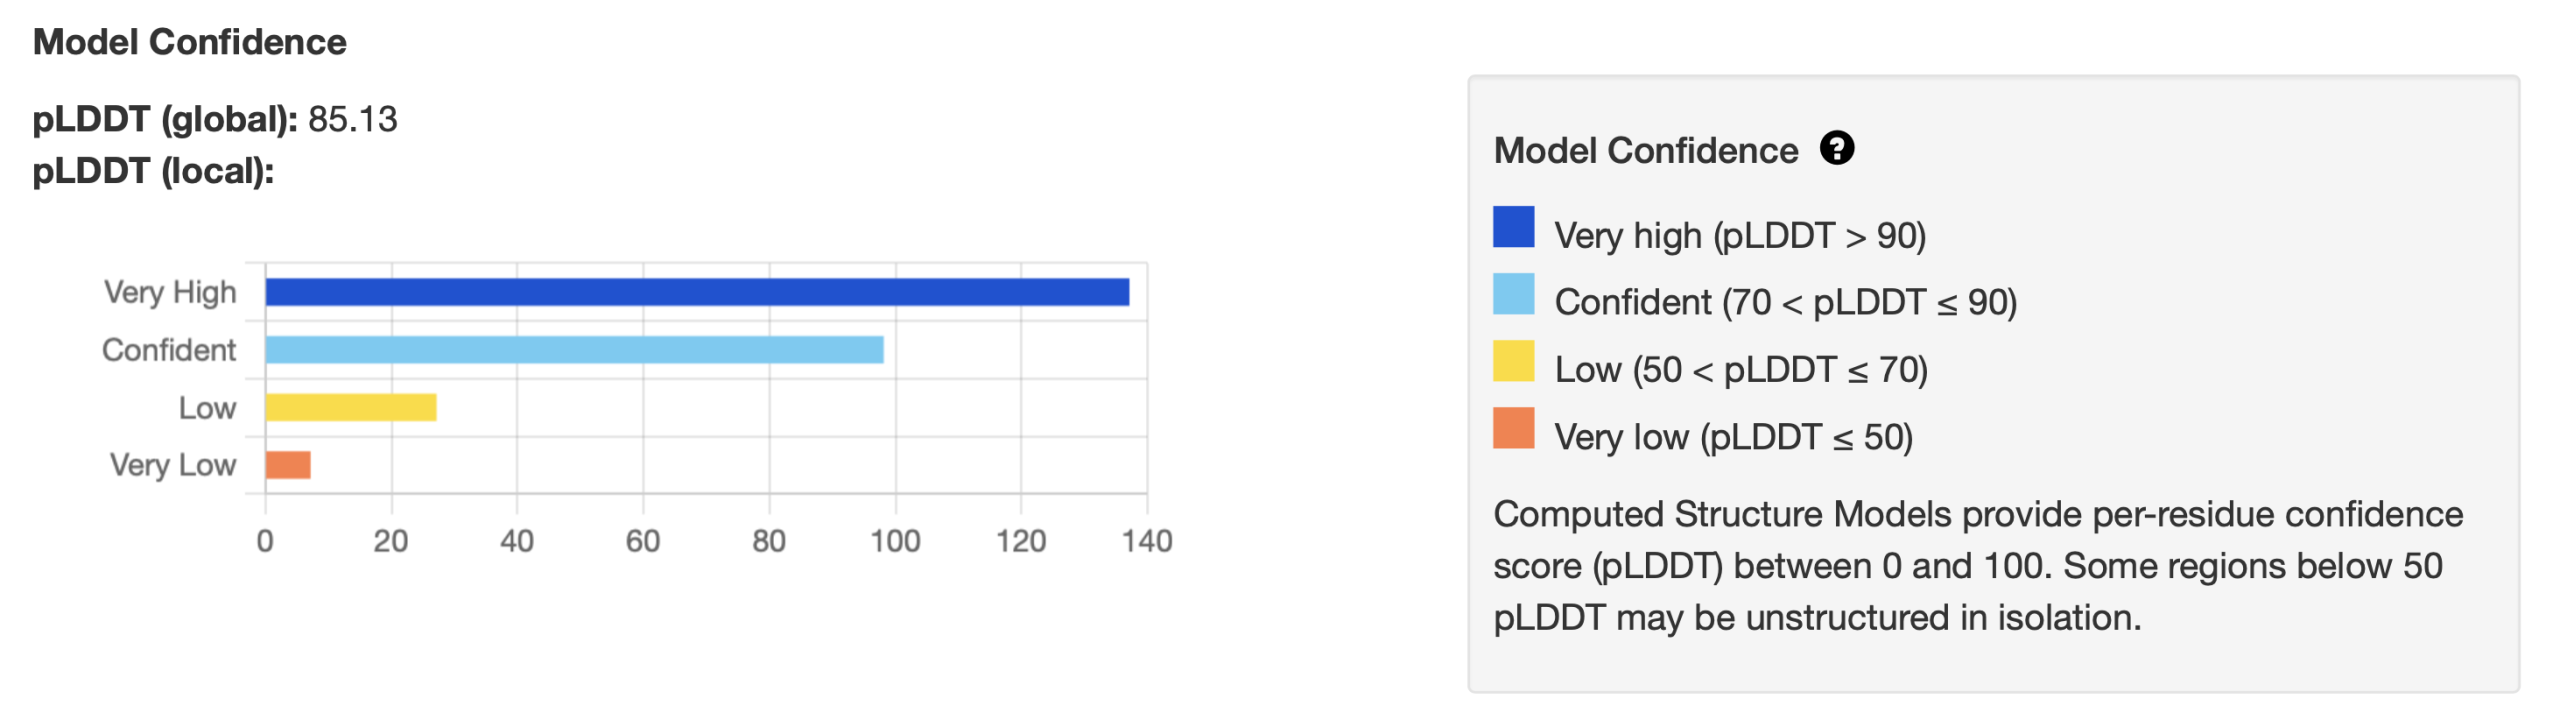
For CSMs produced by AlphaFold and other structure prediction tools, the value of the Predicted Local Distance Difference Test (pLDDT) can be used to evaluate structure quality. The data shown in Figure 4 appears at the top of every PDB entry for a CSM and can be viewed by going to the RCSB and opening the PDB entry file for the structure (see the chapter A Guide to PDB Structures). The pLDDT (global) can range from 0 – 100 and should be ≥ 70 for models that predict the structure with confidence. In addition the pLDDT (local) gives information about how many individual residues fall into each model confidence category (Figure 4). For more information about how the pLDDT values are calculated see the original AlphaFold publication (Jumper, et al., 2021).
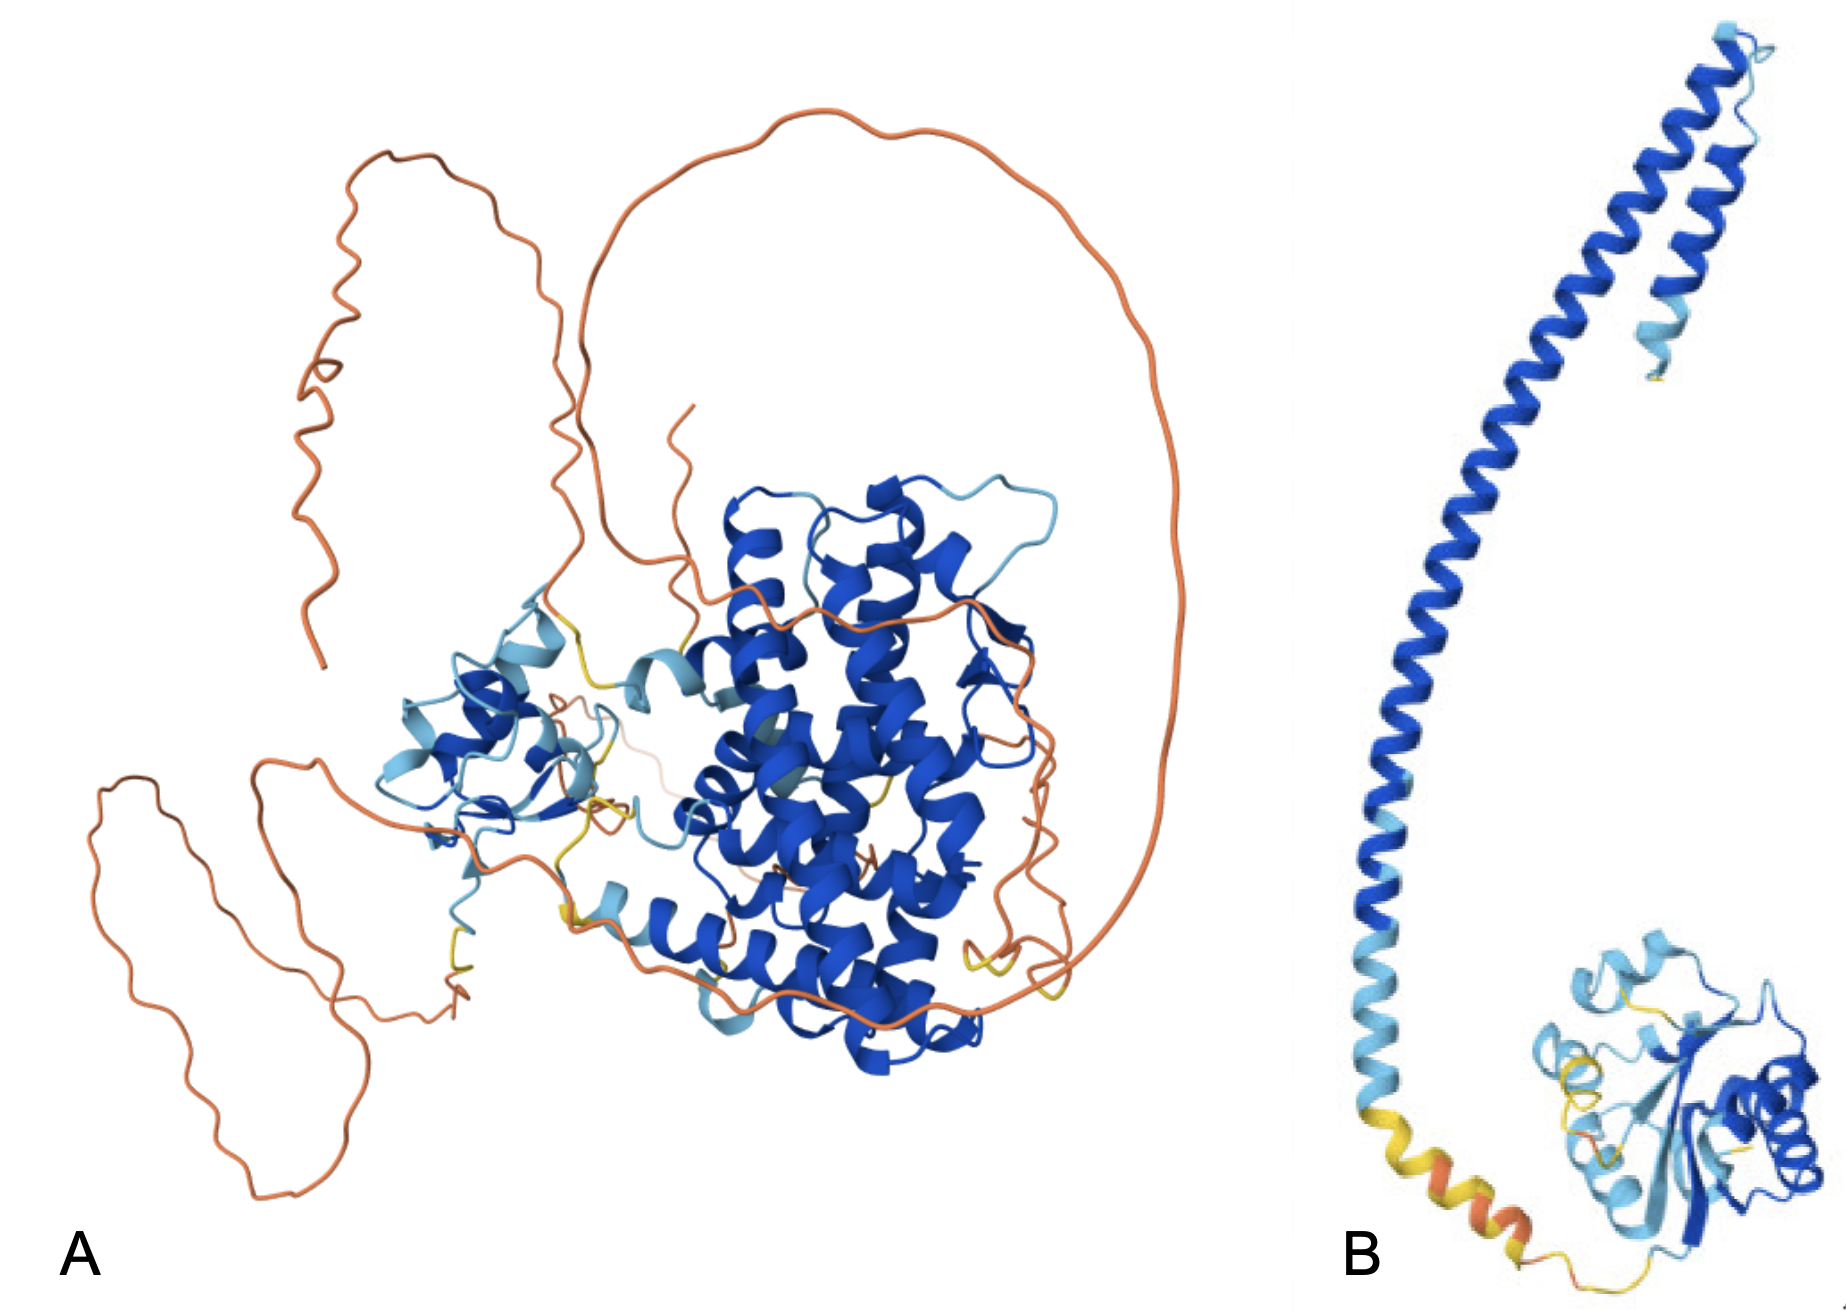
The pLDDT color scheme can also be applied to the 3D visualization of the structure to indicate the confidence in each region (Figure 5). In these two cases most of the structure has been predicted with very high confidence (blue) or as confident (light blue), while there are some regions that are predicted with low confidence (yellow) or very low confidence (orange). As mentioned in Figure 4, residues with pLDDT ≤ 50 (orange) may be unstructured. The PAE (predicted alignment error) is a metric used by AlphaFold to assess the confidence in the model’s representation of the protein’s structure and is explained in the AlphaFold FAQ. PAE is most useful for evaluating inter-subunit contacts and correlates with whether or not two chains interact.
References
Jumper, J., Evans, R., Pritzel, A. et al. (2021). Highly accurate protein structure prediction with AlphaFold. Nature 596, 583–589. https://doi.org/10.1038/s41586-021-03819-2