
X.A. ChimeraX Protein–Protein Interface
Walter Novak and Josh Beckham
Overview: This activity demonstrates how to display interactions at the interface of two macromolecules.
Outcome: The user will be able to display contacts at the interface of two macromolecules and display the non-covalent interactions stabilizing the interface.
Time to complete: 15 minutes
Modeling Skill
- Displaying contacts at a protein:protein interface
About the Model
PDB ID: 6m0j
Protein: SARS-CoV-2 spike receptor-binding domain bound to the ACE2 receptor
Activity: Angiotensin-converting enzyme 2 (Chain A); Spike protein S1 (Chain B); NAG–glycan; Zn2+; Cl–
Description: Receptor for the pandemic virus, SARS-CoV-2
Steps
- Load 6m0j. In the command line, type: open 6m0j
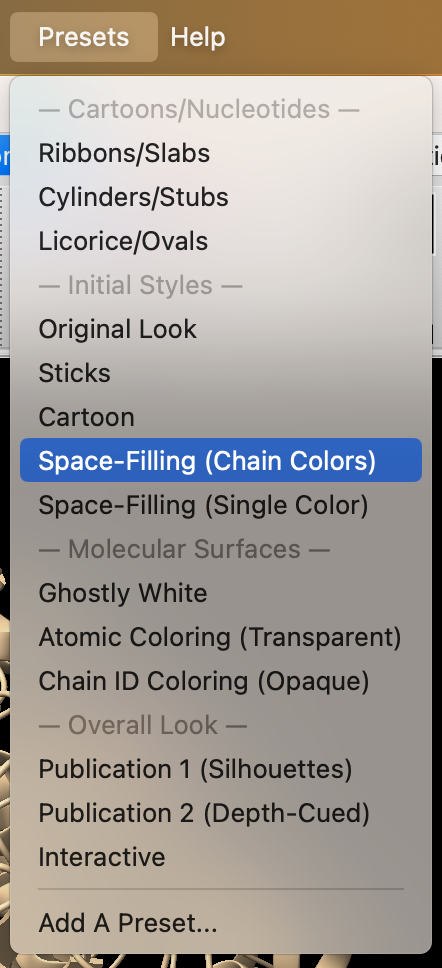
- Use the dropdown menu: Presets → Space-Filling (Chain Colors) (Figure 1).
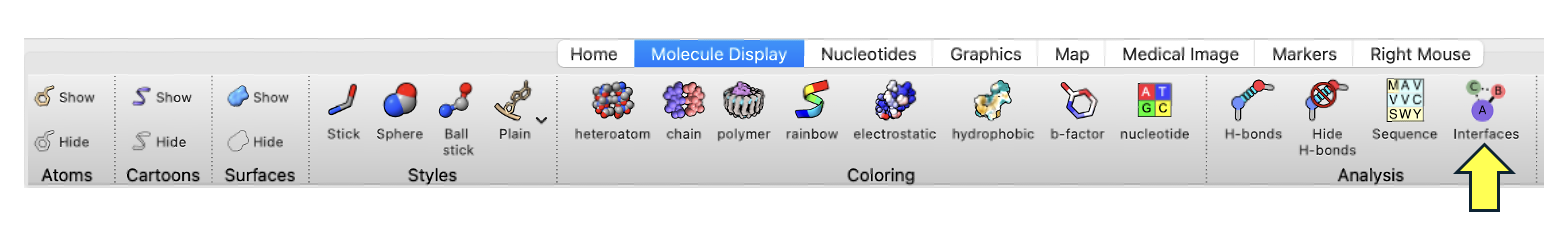
- Within the “Molecule Display” toolbar selection, click “Interfaces” (Figure 2).
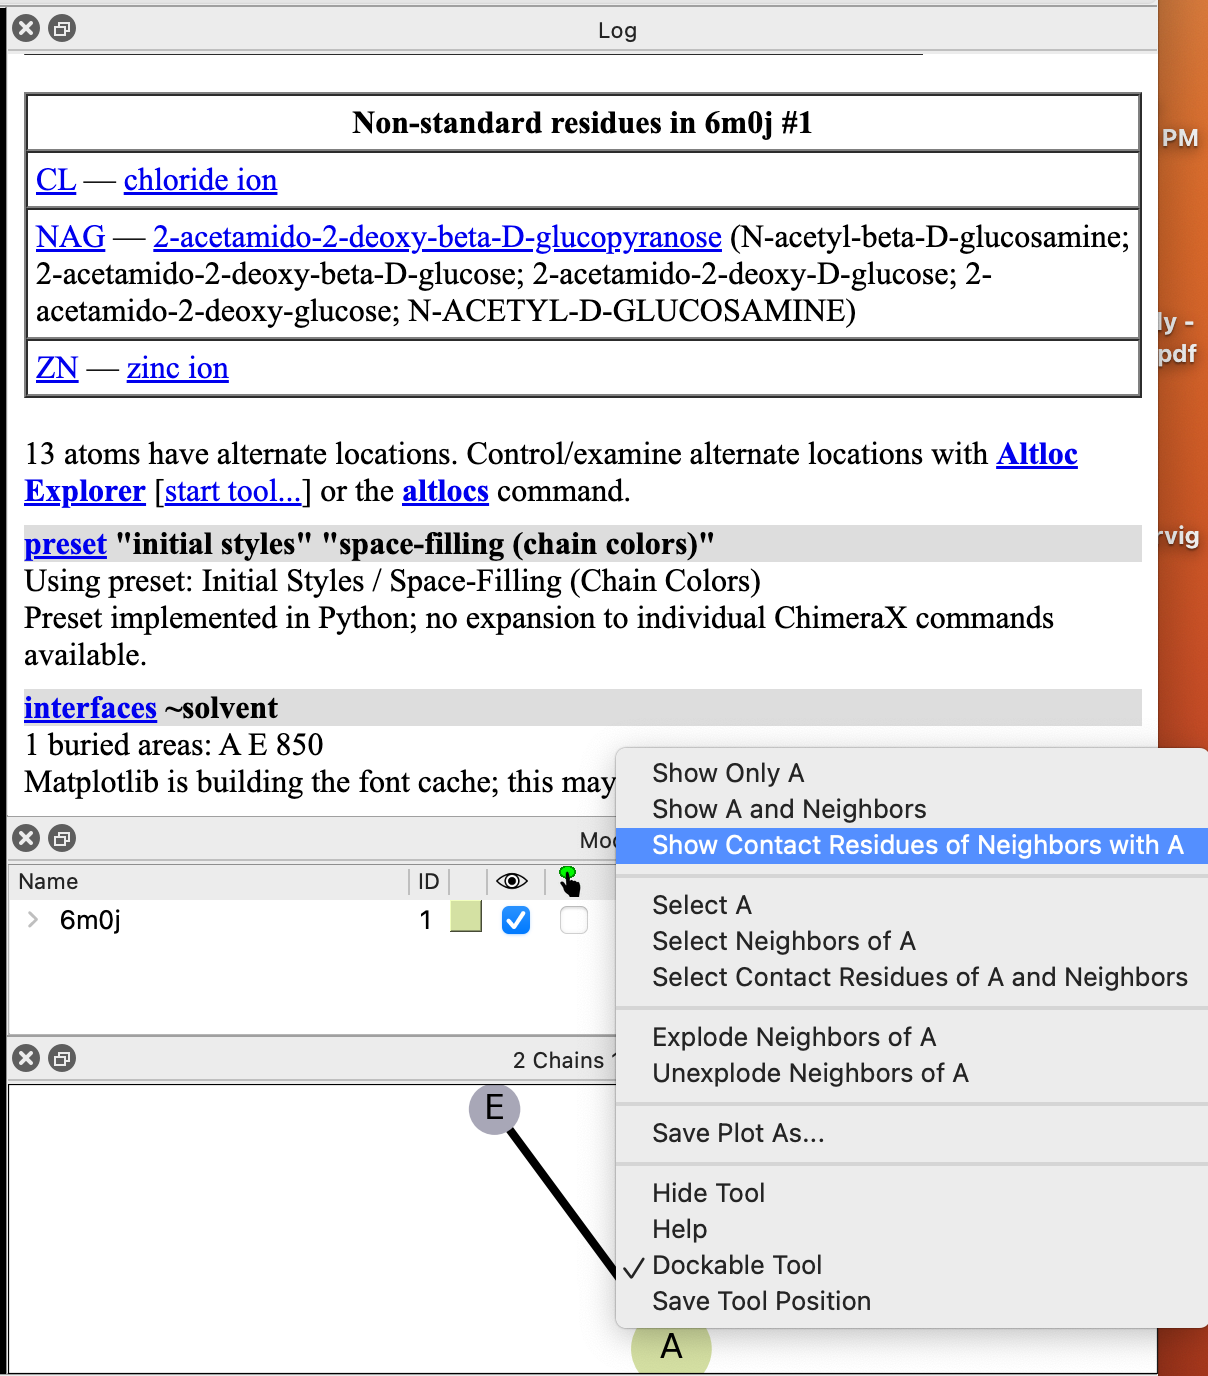
- In the “Interfaces” popup, click on the circle labeled “A” and click “Show Contact Residues of Neighbors with A” (Figure 3).
- Select and hide water molecules.
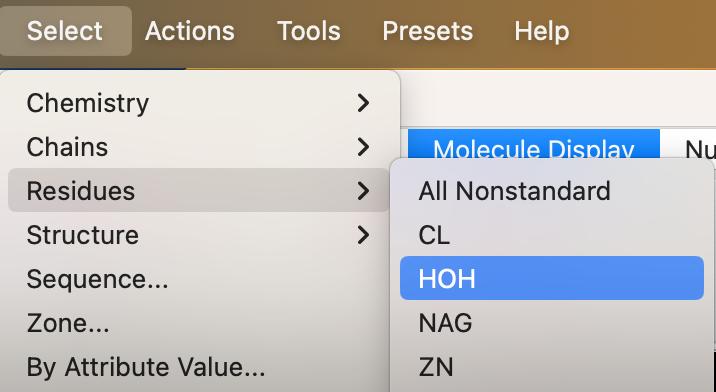
a) From the dropdown menu: Select → Residues → HOH (Figure 4).
b) From the toolbar: Home → Atoms → Hide
- Identify H-bonds at this interface.
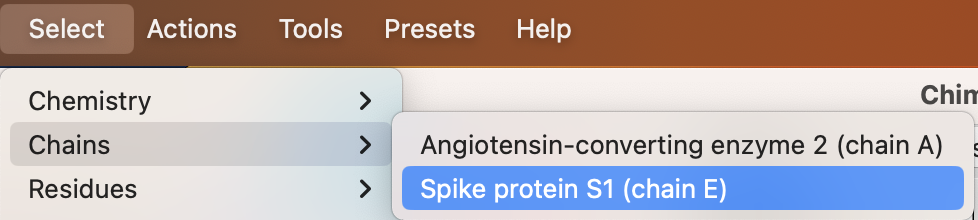
a) Use the dropdown menu to select the Spike protein chain: Select → Chains → Spike protein S1 (chain E) (Figure 5).
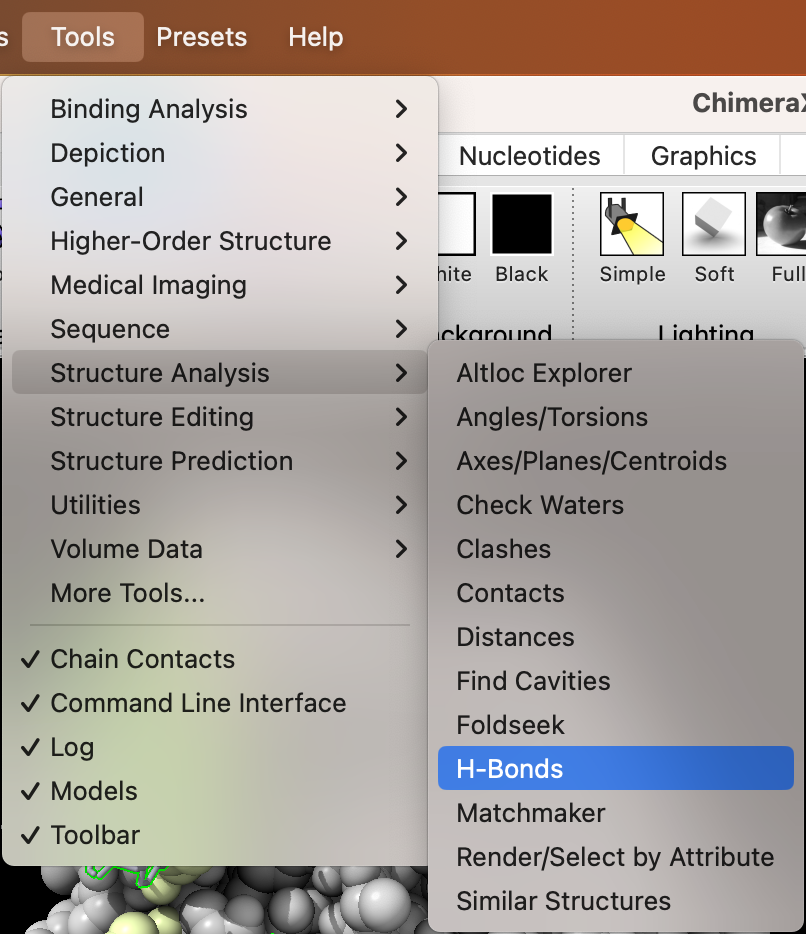
b) Use the dropdown menu to find H-bonds: Tools → Structure Analysis → H-Bonds (Figure 6).
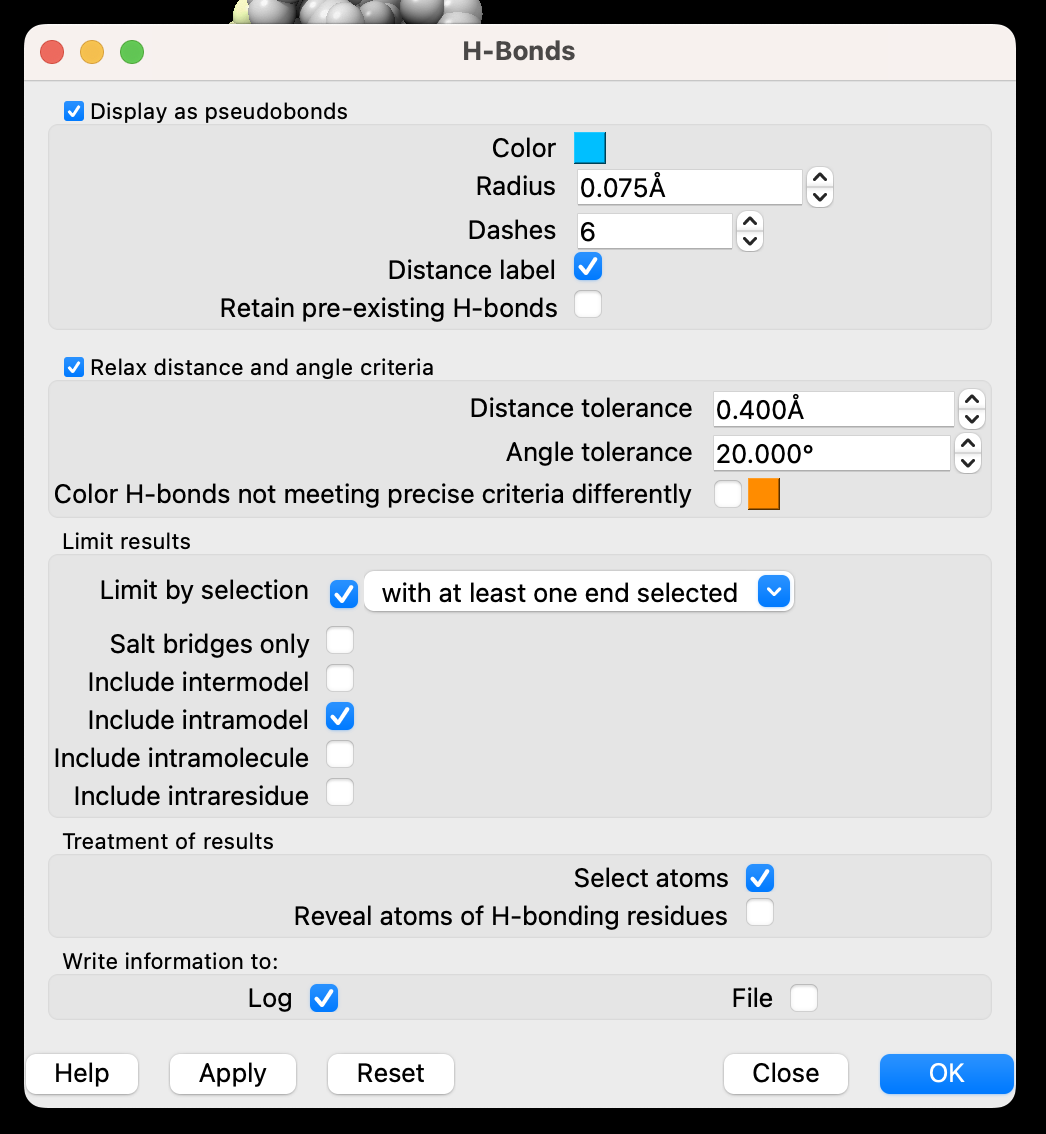
c) In the popup window (Figure 7), ensure the ”Distance label” is checked. Limit selection to “with at least one end selected,” and only ”Include intramodel.” For treatment of results, check only “Select atoms.” Optionally, you can ‘Write Information to: Log”. Then ‘Apply’ and ‘Close’.
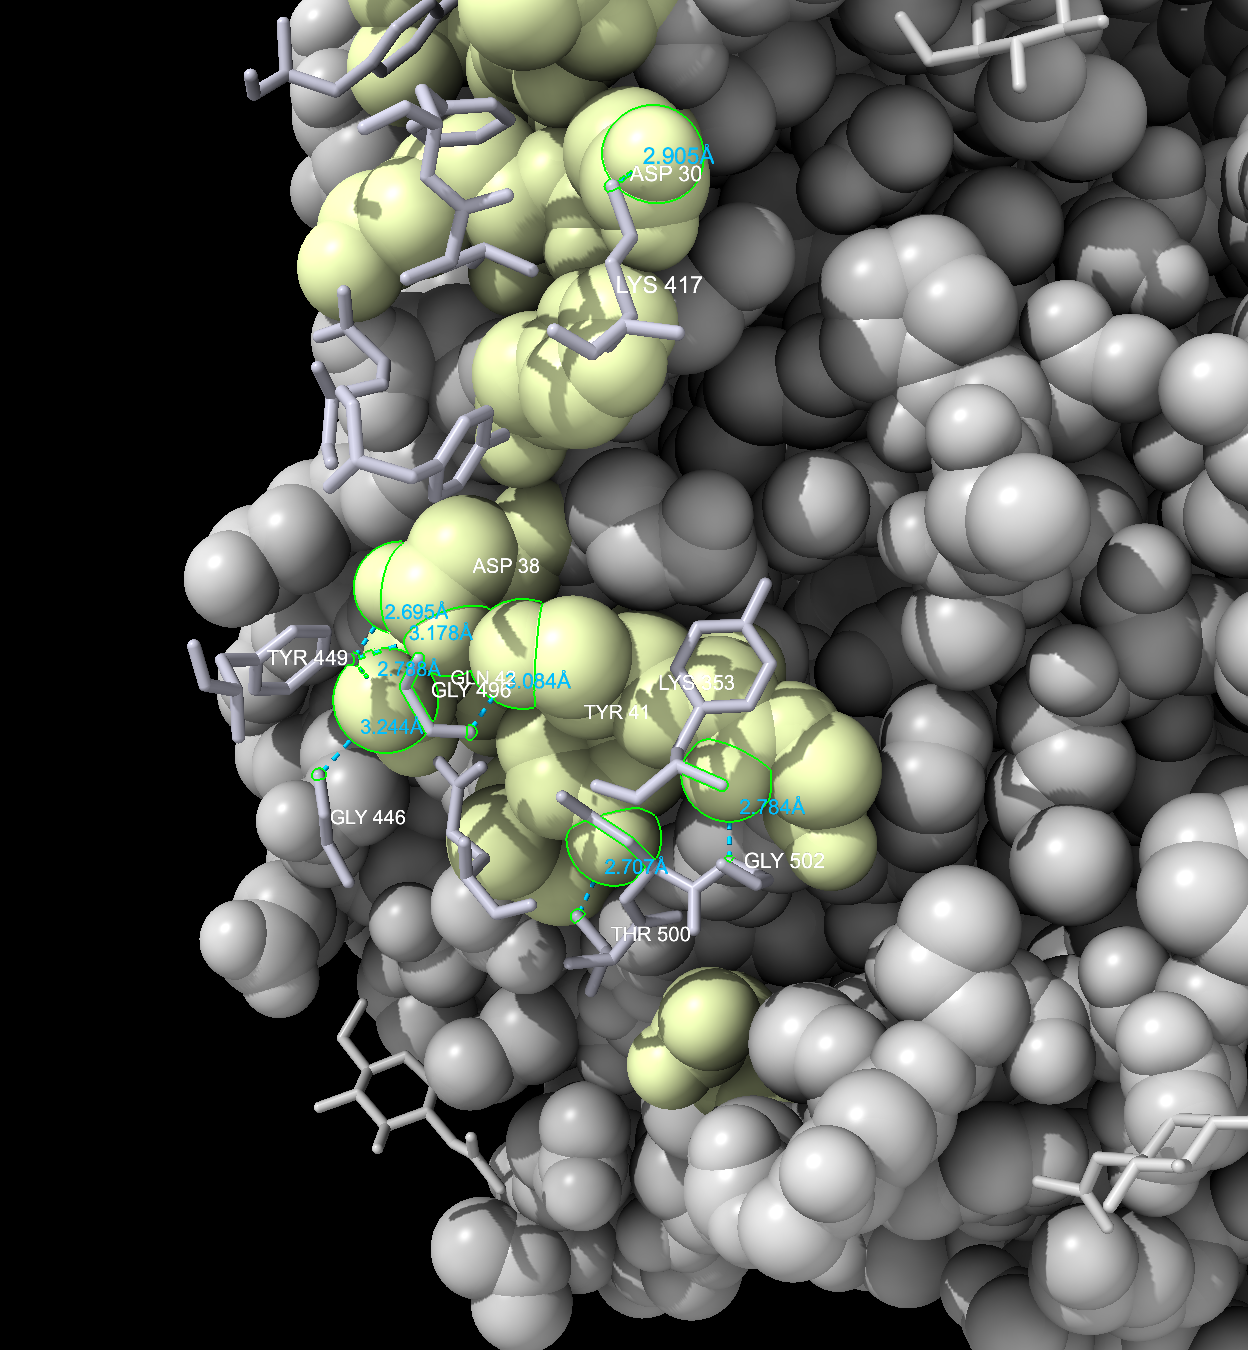
- Add labels to the amino acid residues on both the ACE-2 and Spike interfaces. Use the dropdown menu: Actions → Label → Residues → Name and Number.
- Ctrl+click in the empty space of the structure viewer to deselect (Figure 8).
- Show only the interaction between an aspartate and a lysine – D30 and K417 – and measure the distance.
a) We will focus in on two amino acids: Aspartate 30 ‘D30’ (in chain A) and Lysine 417 ‘K417’ (in chain E). Find D30 and K417 in the structure.
b) Ctrl + Click on ‘ASP 30’ in the structure, then Use the dropdown menu to zoom in: Actions → Focus (or Actions → View on a PC) . Then manually zoom out a little so that you can see both residues (shift + mouse wheel).
-
- An alternative way to select the D30 (ASP 30) is to type in the command line: select /A:30
c) Select both residues: use Ctrl + Shift + Click on the LYS 417. Expand selection to include full residues by clicking the up arrow until you see then entire residue selected. (If too much gets selected, click the down arrow.)
-
- Alternatively, type in the command line: select /A:30 /E:417
d) Zoom in on the selection: Actions → Focus (or Actions → View on a PC).
e) Show ASP 30 and LYS 417 as Sticks: Use the dropdown menu: Home → Styles → Stick .
- Select and Hide everything else: Select → Invert → All Models.
a) Within the “Home” toolbar selection, click “Atoms” → Hide.
b) Also, if not hidden already, hide the labels for the rest of the protein that isn’t the two amino acids using ‘Actions’ → ‘Label’ → ‘Residues’ → ‘Off’.
-
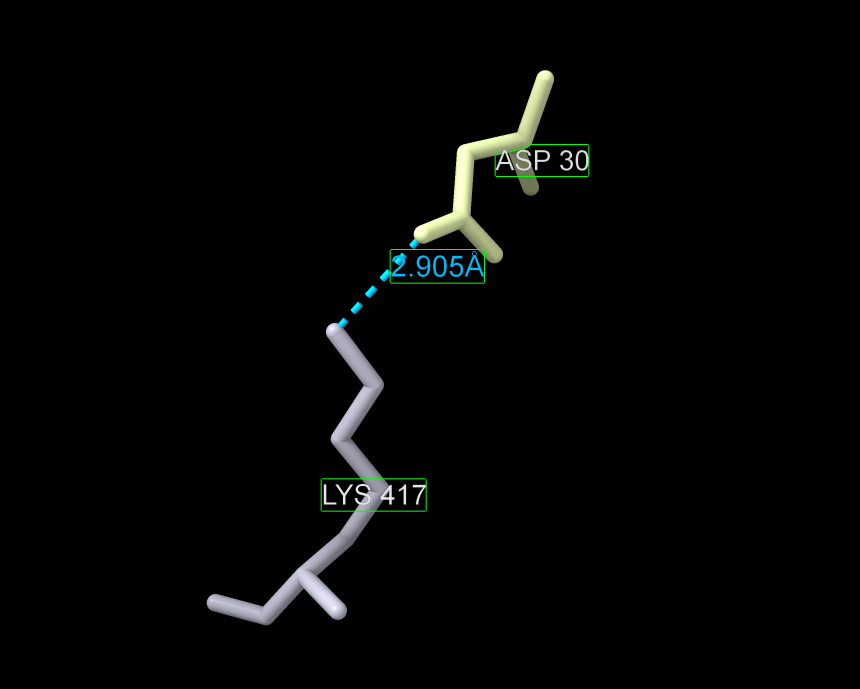
- Show image of just the two amino acids with the measurement (Figure 9).
- Re-show the selection of the rest of the proteins.
-
- Show cartoon backbone for both proteins: Within the “Home” toolbar selection, click “Cartoons” , ‘Show’.
Note: This is also in “Molecule Display’ in the toolbar.
- Zoom in on the selection: At the menu options at the top, click “Actions’ → ‘Focus’ (or Actions → View on a PC).
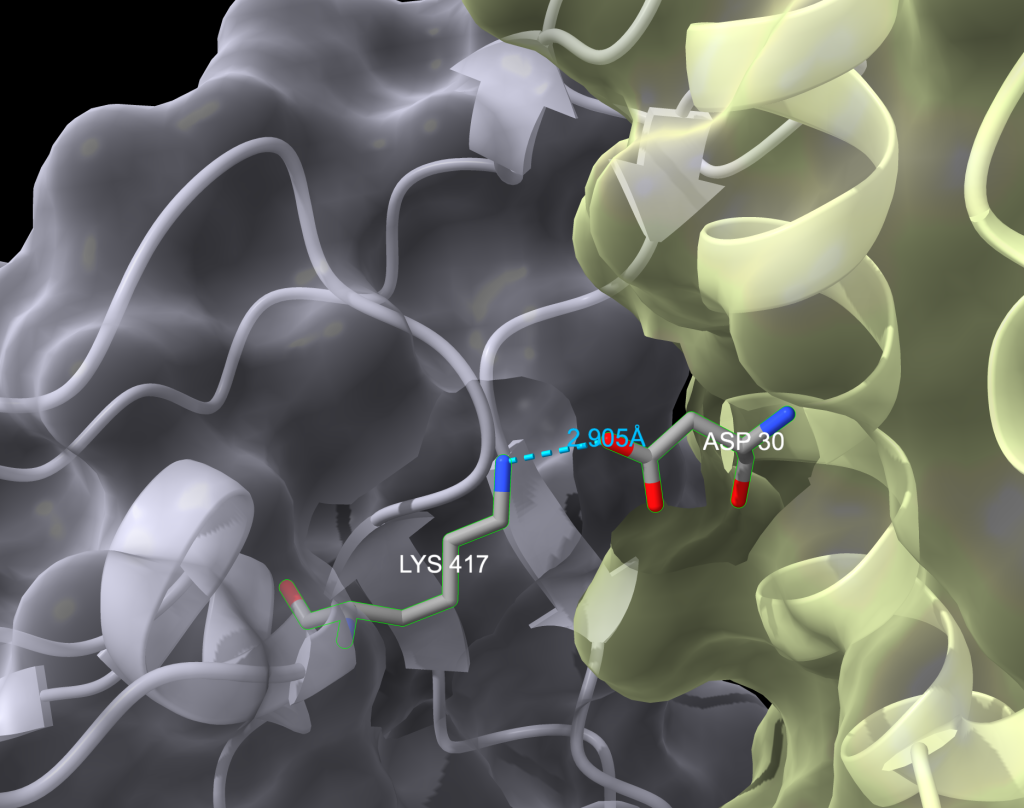
- Show surface for both proteins.
- Within the “Molecule Display” toolbar selection, click “Surface” , ‘Show’.
- Increase transparency of surfaces so that the cartoon backbone can be seen also.
- At the menu options at the top, click ‘Actions’, → ‘Surface’, → ‘Transparency’ → set to ‘60’.
- ‘Ctrl’ + ‘Click’ in the empty space in the structure viewer to deselect the surfaces.
- Recolor the atoms in the two amino acids by element (D30 (in chain A) and K417 (in chain E)).
- Select them again by ‘Ctrl’ + ‘Shift’ +’ Click’ on each amino acid in the structure viewer, then hit ‘up arrow’ twice to select all the atoms in the residues.
- Alternatively, type in the command line: select /A:30 /E:417
- Zoom in on the selection: At the menu options at the top, click “Actions’ → ‘Focus’ (or Actions → View on a PC).
- At the menu options at the top, click ‘Actions’, → ‘Color’, → ‘By Heteroatom’.
- Select them again by ‘Ctrl’ + ‘Shift’ +’ Click’ on each amino acid in the structure viewer, then hit ‘up arrow’ twice to select all the atoms in the residues.
- (Optional) Save and close the session.
Jump to the next ChimeraX tutorial: XI.A. ChimeraX Superimposition.