
VIII.A. ChimeraX Molecular Interactions
Walter Novak and Josh Beckham
Overview: This activity demonstrates how use one part of a macromolecular structure to select nearby objects and show the potential molecular interactions with them.
Outcome: The user will be able to focus on a specific part of a macromolecule of interest, display its surrounding residues, and visualize noncovalent interactions within a 5Å radius of the target.
Time to complete: 15 minutes
Modeling Skills
- Focusing on a specific part of the macromolecule of interest
- Selecting objects using the command line
- Selecting groups within 5Å
- Displaying noncovalent interactions
About the Model
PDB ID: 1xww
Protein: Low molecular weight protein tyrosine phosphatase
Activity: hydrolyzes Tyr-OPO32- phosphoester bond
Description: single chain, bound SO42- competitive inhibitor, bound glycerol (nonspecific stabilizer)
Steps
- Reload 1xww using the command line. Type: open 1xww
- Hide all the residues, keeping only the cartoon. Ensure “Home” is selected in the toolbar selector, and click ”Hide” in the “Atoms” toolbar.
- Select the residues within 5 Å of the sulfate using the command line. Type: sel zone :SO4 5 extend true residues true
- Then, to show these residues as sticks, in the “Home” toolbar selector, click ”Show” in the “Atoms” toolbar.
- Zoom in on the active site using the dropdown menu: Actions → Focus.
- Clear the selection by Ctrl+clicking in the empty space of the structure viewer.
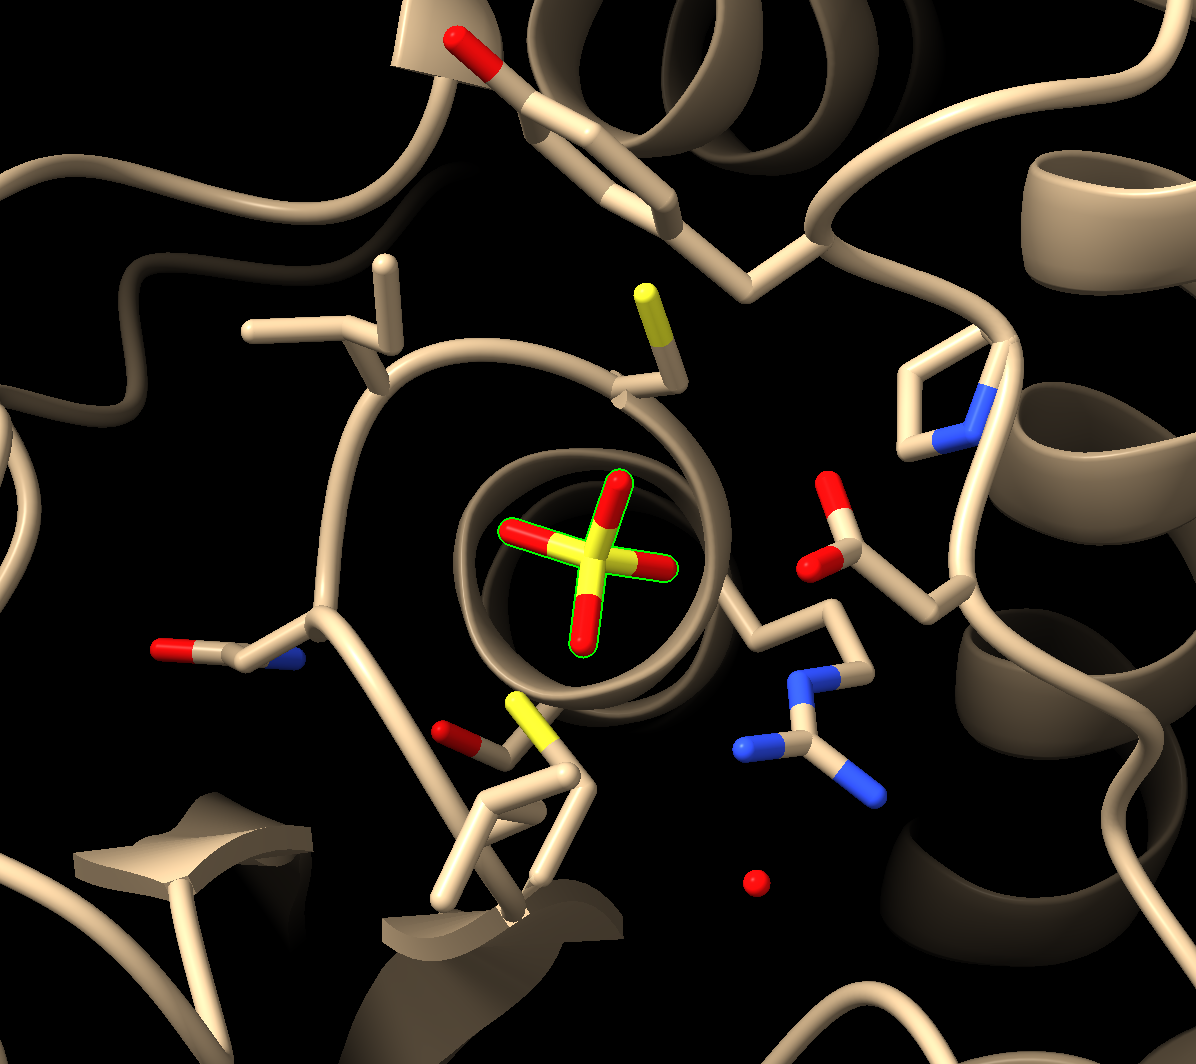
- Select the sulfate using the mouse.
a) Rotate the model until you can see the sulfate clearly
b) Ctrl+click on the sulfate.
c) Press the up arrow on the keyboard until all atoms of the sulfate are highlighted (Figure 1).
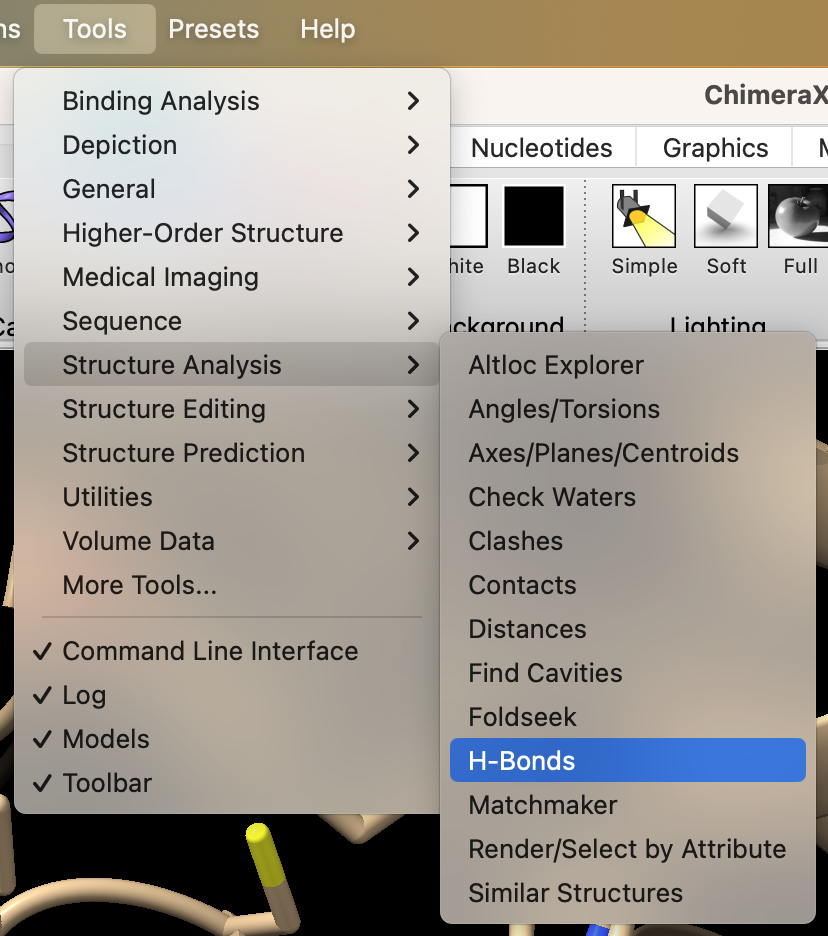
- Find the H-bonds between the ligand and active site. In the dropdown menu: Tools → Structure Analysis → H-Bonds.
- Select the following in the popup menu (Figure 3),
a) Under the subheading “Limit results,” ensure that ”Limit by selection” is checked and set to “with at least one end selected.”
b) Ensure that “Include intramodel” is checked.
c) Uncheck all other boxes in ”Limit results.”
d) Under the subheading “Treatment of results,” select “Reveal atoms of H-bonding residues.”
e) Finally, in the “Write information to” section, check the “Log” box.
f) Click “Ok” to search for H-bonds.
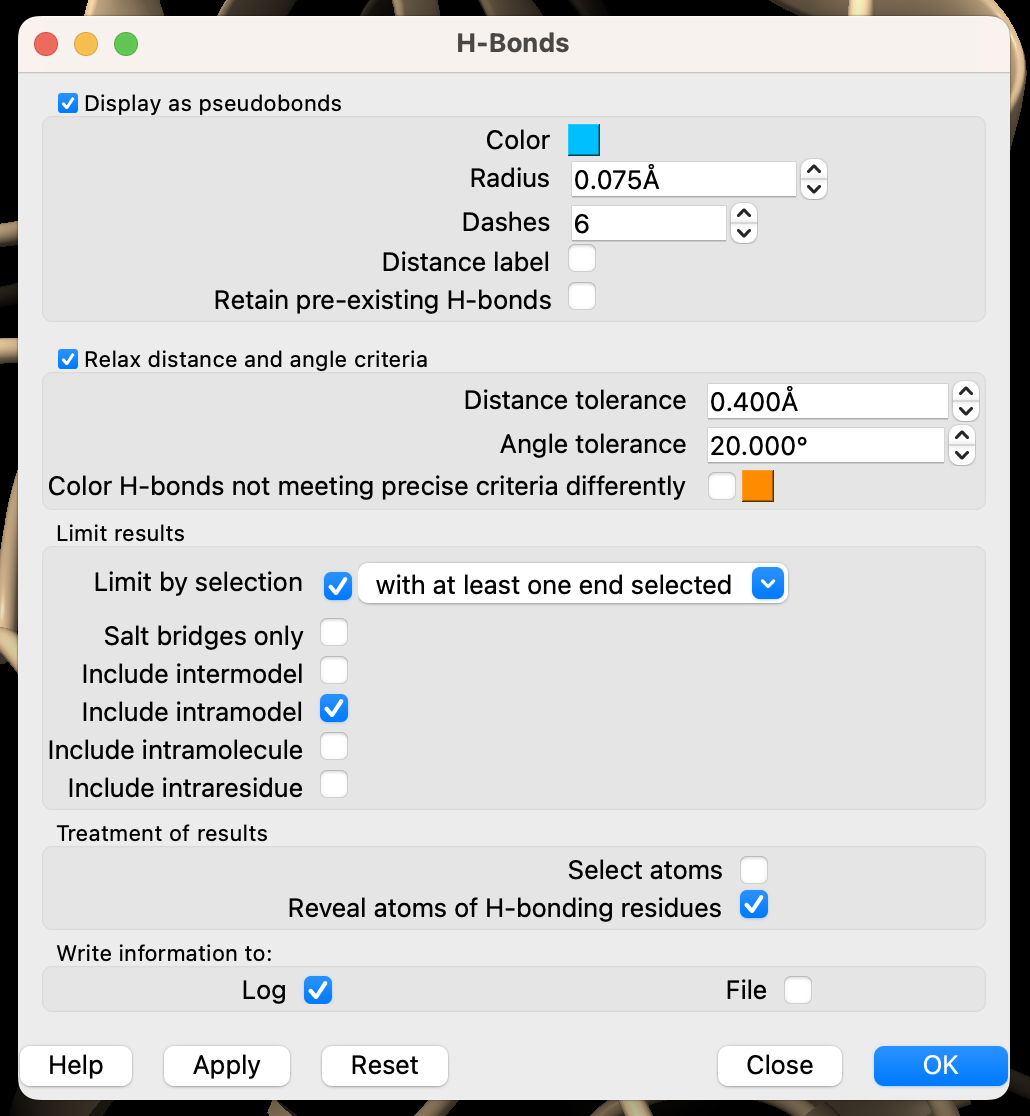
Note: If you also check the box that says: “Color H-bonds not meeting precise criteria differently” ChimeraX will use different colors to indicate that certain predictions are close, but do not match the search criteria exactly (Figure 4).

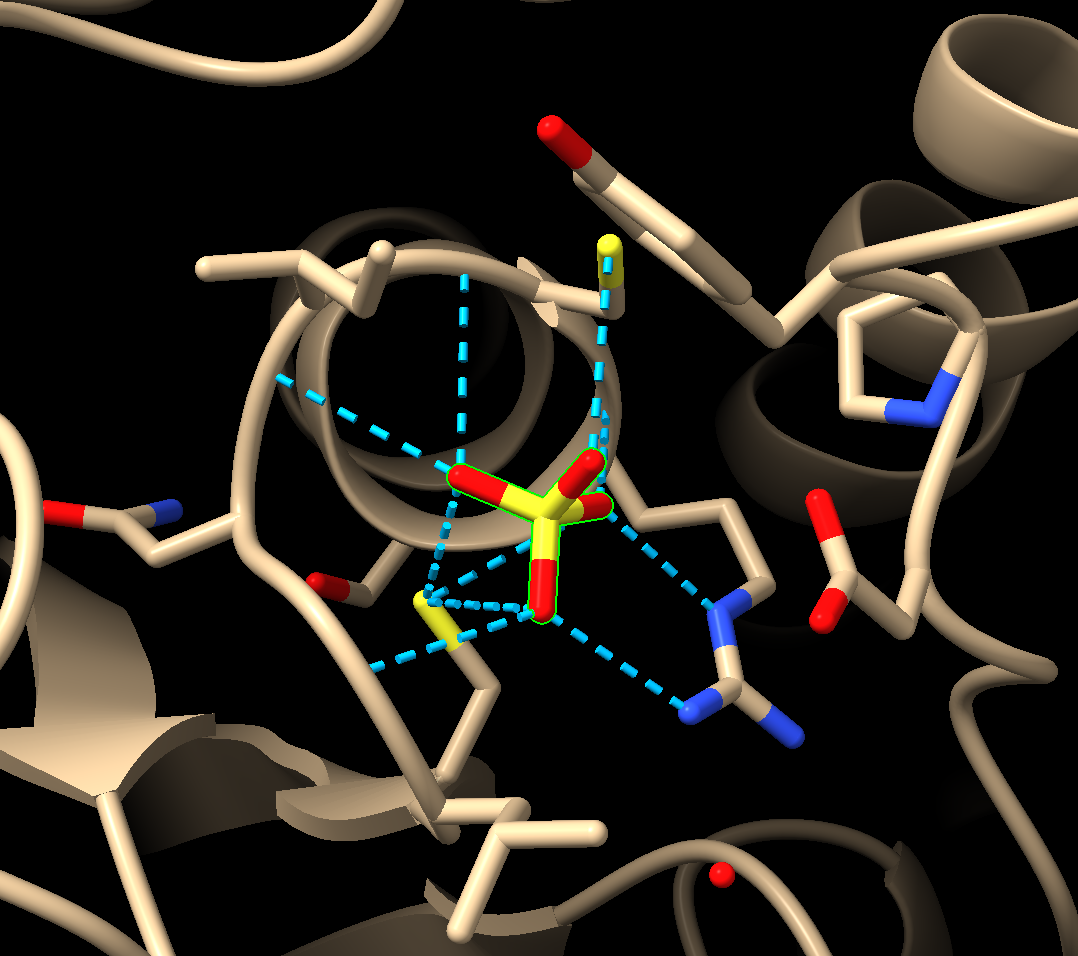
- If you would like to label the distances of the bonds in the viewer, rerun the H-bond analysis and check the “Distance label” box near the top of the popup.
- (Optional) Save and close the session.
Jump to the next ChimeraX tutorial: IX.A. ChimeraX Manual Measurement
Video Tutorial
This video goes over 5Å selection with a different protein.