
IX.B. iCn3D Manual Measurement
Henry V. Jakubowski and Kristen Procko
Overview: This activity demonstrates how to manually measure distances.
Outcome: The user will be able to measure and label distances between two atoms (e.g., from an atom in a ligand to an atom in the enzyme active site).
Time to complete: 15 minutes
Modeling Skills
- Selecting objects using the command line
- Selecting groups within 5 Angstroms, saving selections
- Manually measure distances between atoms (e.g., from a ligand to an active site amino acid residue)
About the Model
PDB ID: 1eve
Protein: Acetylcholinesterase
Activity: hydrolyzes the neurotransmitter acetylcholine to form acetate and choline
Description: single chain, bound to the drug Aricept (donepezil), covalently bound to five NAG glycan molecules
Steps
Loading and Rendering the Structure
- Load the protein
a) Open iCn3D
b) In List of PDB, MMDB, or AlphaFold UniProt structures, type 1eve
c) Click enter or “load biological unit”.
- Select and render the ligand
a) Alt+Click on the ligand, E20, near the center of the protein, to select it
b) Save the selection using the dropdown menu: Select → Save selection
c) In the popup window, type “aricept”
d) Render the ligand as ball and stick. In the dropdown menu: Style → chemicals → ball and stick
Note: We are rendering the ligand as ball and stick to make it readily distinguishable from the amino acid side chains, which will automatically render as stick in a later step. At the time of this writing, a limitation of iCn3D is that it doesn’t allow for a straightforward manner to color carbon atoms a different color while retaining CPK coloring.
Render Nonpolar Interactions Automatically
We will first render dispersion interactions automatically to see what they look like. This will automatically show the side chains, which we will also render. Alternatively, we could use the ligand to create a 5Å sphere (Activity VII.B.) to visualize the binding site side chains.
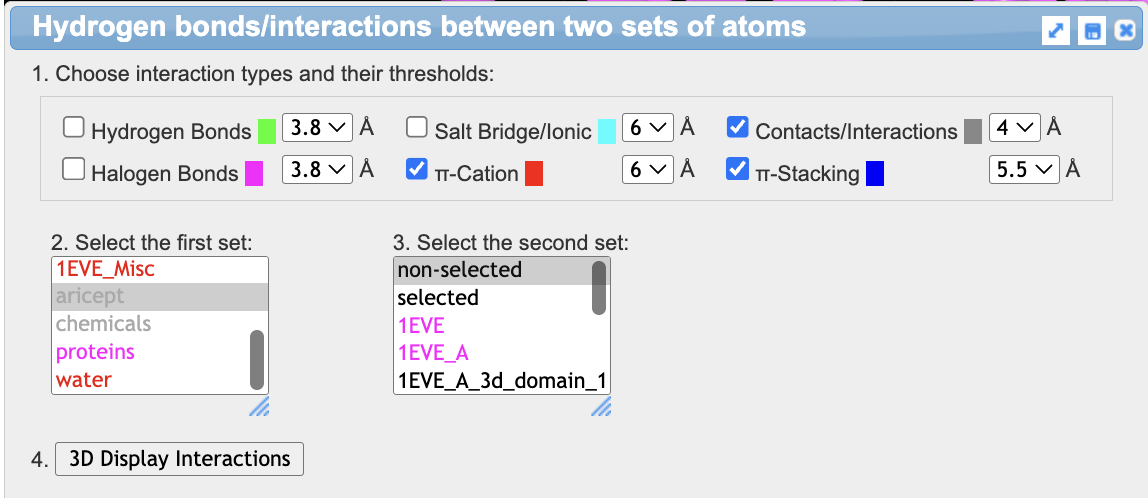
- Show the interactions
a) In the dropdown menu: Analysis → Interactions
b) As the first set, choose “aricept”
c) for the second set, leave “non-selected” as the choice
d) Check the following noncovalent interactions: π-cation, contacts/interactions, and π-stacking
e) Click 3D Display Interactions. This will display interacting side chains.
- Color the displayed side chains using CPK coloring. In the dropdown menu: Color → Atom
- Now, clear the automatic interactions. In the Analysis popup, uncheck everything and click “3D Display Interactions”.
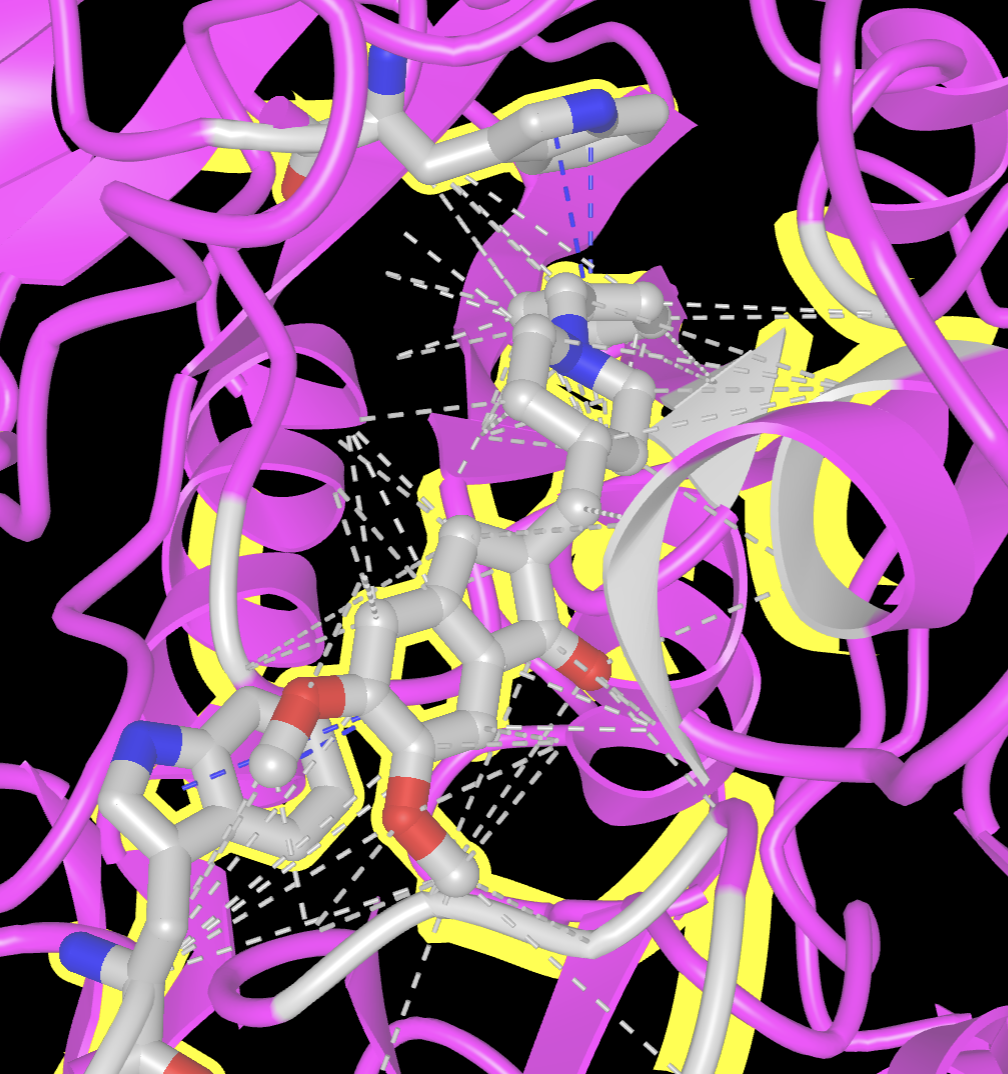
Note: Notice the interactions generated in this section looked very busy, and there were many. Sometimes for simplicity and ease of viewing, it is preferred to show one or two representative contacts with their distances. This is what we will accomplish in the next section.
Manual Measurement in iCn3D
- Set up the measurement tool. In the dropdown menu: Analysis → DIstance → between Two Atoms. The distance measurement popup will appear.
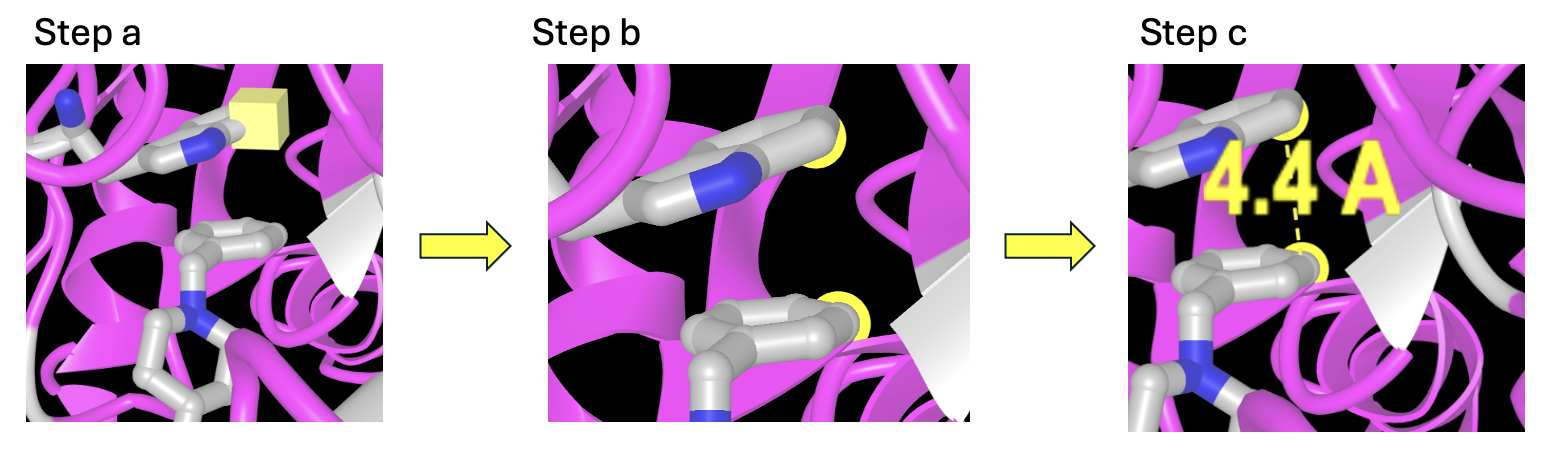
- Measure the distance between an atom on an aromatic ring of Aricept and an aromatic amino acid side chain.
a) Alt+click (PC) or Option+click (Mac) on the first atom. A square will appear around it.
b) Next, control+click on the second atom.
c) Then, in the distance measurement popup, click “display”
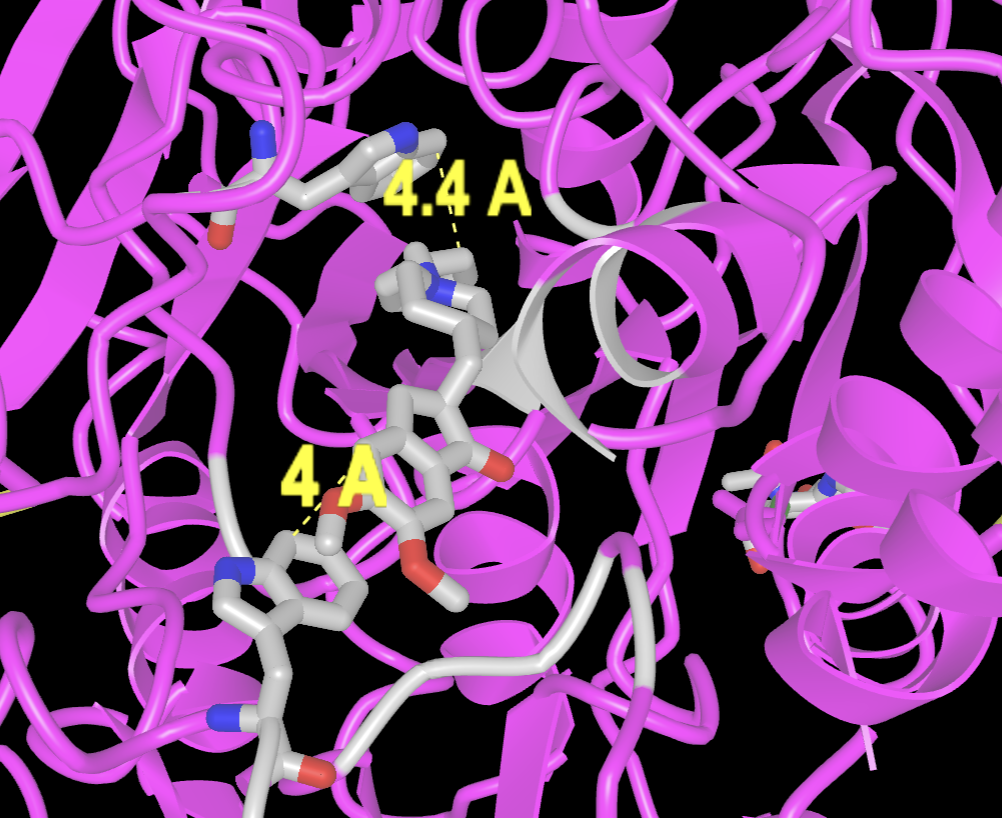
- To measure another distance:
a) Alt+click a new atom, and then ctrl+click a second one.
b) Then, in the distance measurement popup, click “display”
- If desired, the ligand can be changed to a stick rendering.
a) In the dropdown menus: Select → Select on 3D → residues
b) Alt+Click on aricept
c) In the dropdown menus: Style → Chemicals → Stick
d) Remove the highlight around Aricept. In the dropdown menus: Select → Toggle highlight
Jump to the next iCn3D tutorial: X.B. iCn3D Protein–Protein Interface