
XII.A. In Silico Mutagenesis and Structural Analysis with ChimeraX
Amanda Galan-Davila
Overview: This activity demonstrates how to manually modify an amino acid residue to model protein mutagenesis.
Outcome: The user will be able to change the identity of an amino acid residue in order to visualize the impact of mutagenesis on the protein of interest.
Time to complete: 15 minutes
Modeling Skills
- Changing the identity of an amino acid residue using the mutagenesis tool
- Selecting the rotamer that best fits the structure
- Visualizing the impact of mutagenesis on the contour of a cavity in a protein
About the Models
PDB ID: 4LTV
Protein: Epi-isozizaene synthase (EIZS)
Activity: Cyclizes the isoprenoid precursor, farnesyl diphosphate (FPP) to form the tricyclic terpene epi-isozizaene. Epi-isozizaene is an intermediate in the biosynthesis of the natural product albaflavenoid.
Description: Single chain, no ligands bound in the active site, two sulfate ions
Note: We will be using the commands to change the identity of a specific amino acid residue in the enzyme. The amino acid residue, F96, that is mutated in this exercise is on the inner surface of the active site pocket. Mutagenesis experiments (Aaron et al, 2010, Li. et al., 2014) have shown that when this residue is mutated, the change in the contour and electrostatics of the active site pocket result in a dramatic change in the identity of isoprenoid products formed. The F96A mutation changes main product of the enzyme from epi-isozizaene to β–farnesene, and the F96W mutation changes the main product from epi-isozizaene to (+)-zizaene.
Steps
Substitution (mutagenesis) of an amino acid residue with rotamer selection
Note: This set of steps will produce a mutation at a single amino acid residue in the protein and allow the user to select a conformation of the new residue that has the fewest steric clashes with existing atoms in the structure.
- In the command line, type: open 4LTV
- Determine what mutation will be investigated. In this example, it will be the F96W mutation.
- Show the side chains by selecting: (from the top menu) Molecule Display → Atoms → Show.
- Display the amino acid sequence by selecting: (from the top menu) Molecule Display → Analysis → Sequence.
- Identify residue F96. In the command line, type select :96
- Then color residue F96 by selecting: Actions → Color → Magenta (or select preferred color scheme). See Figure 1.
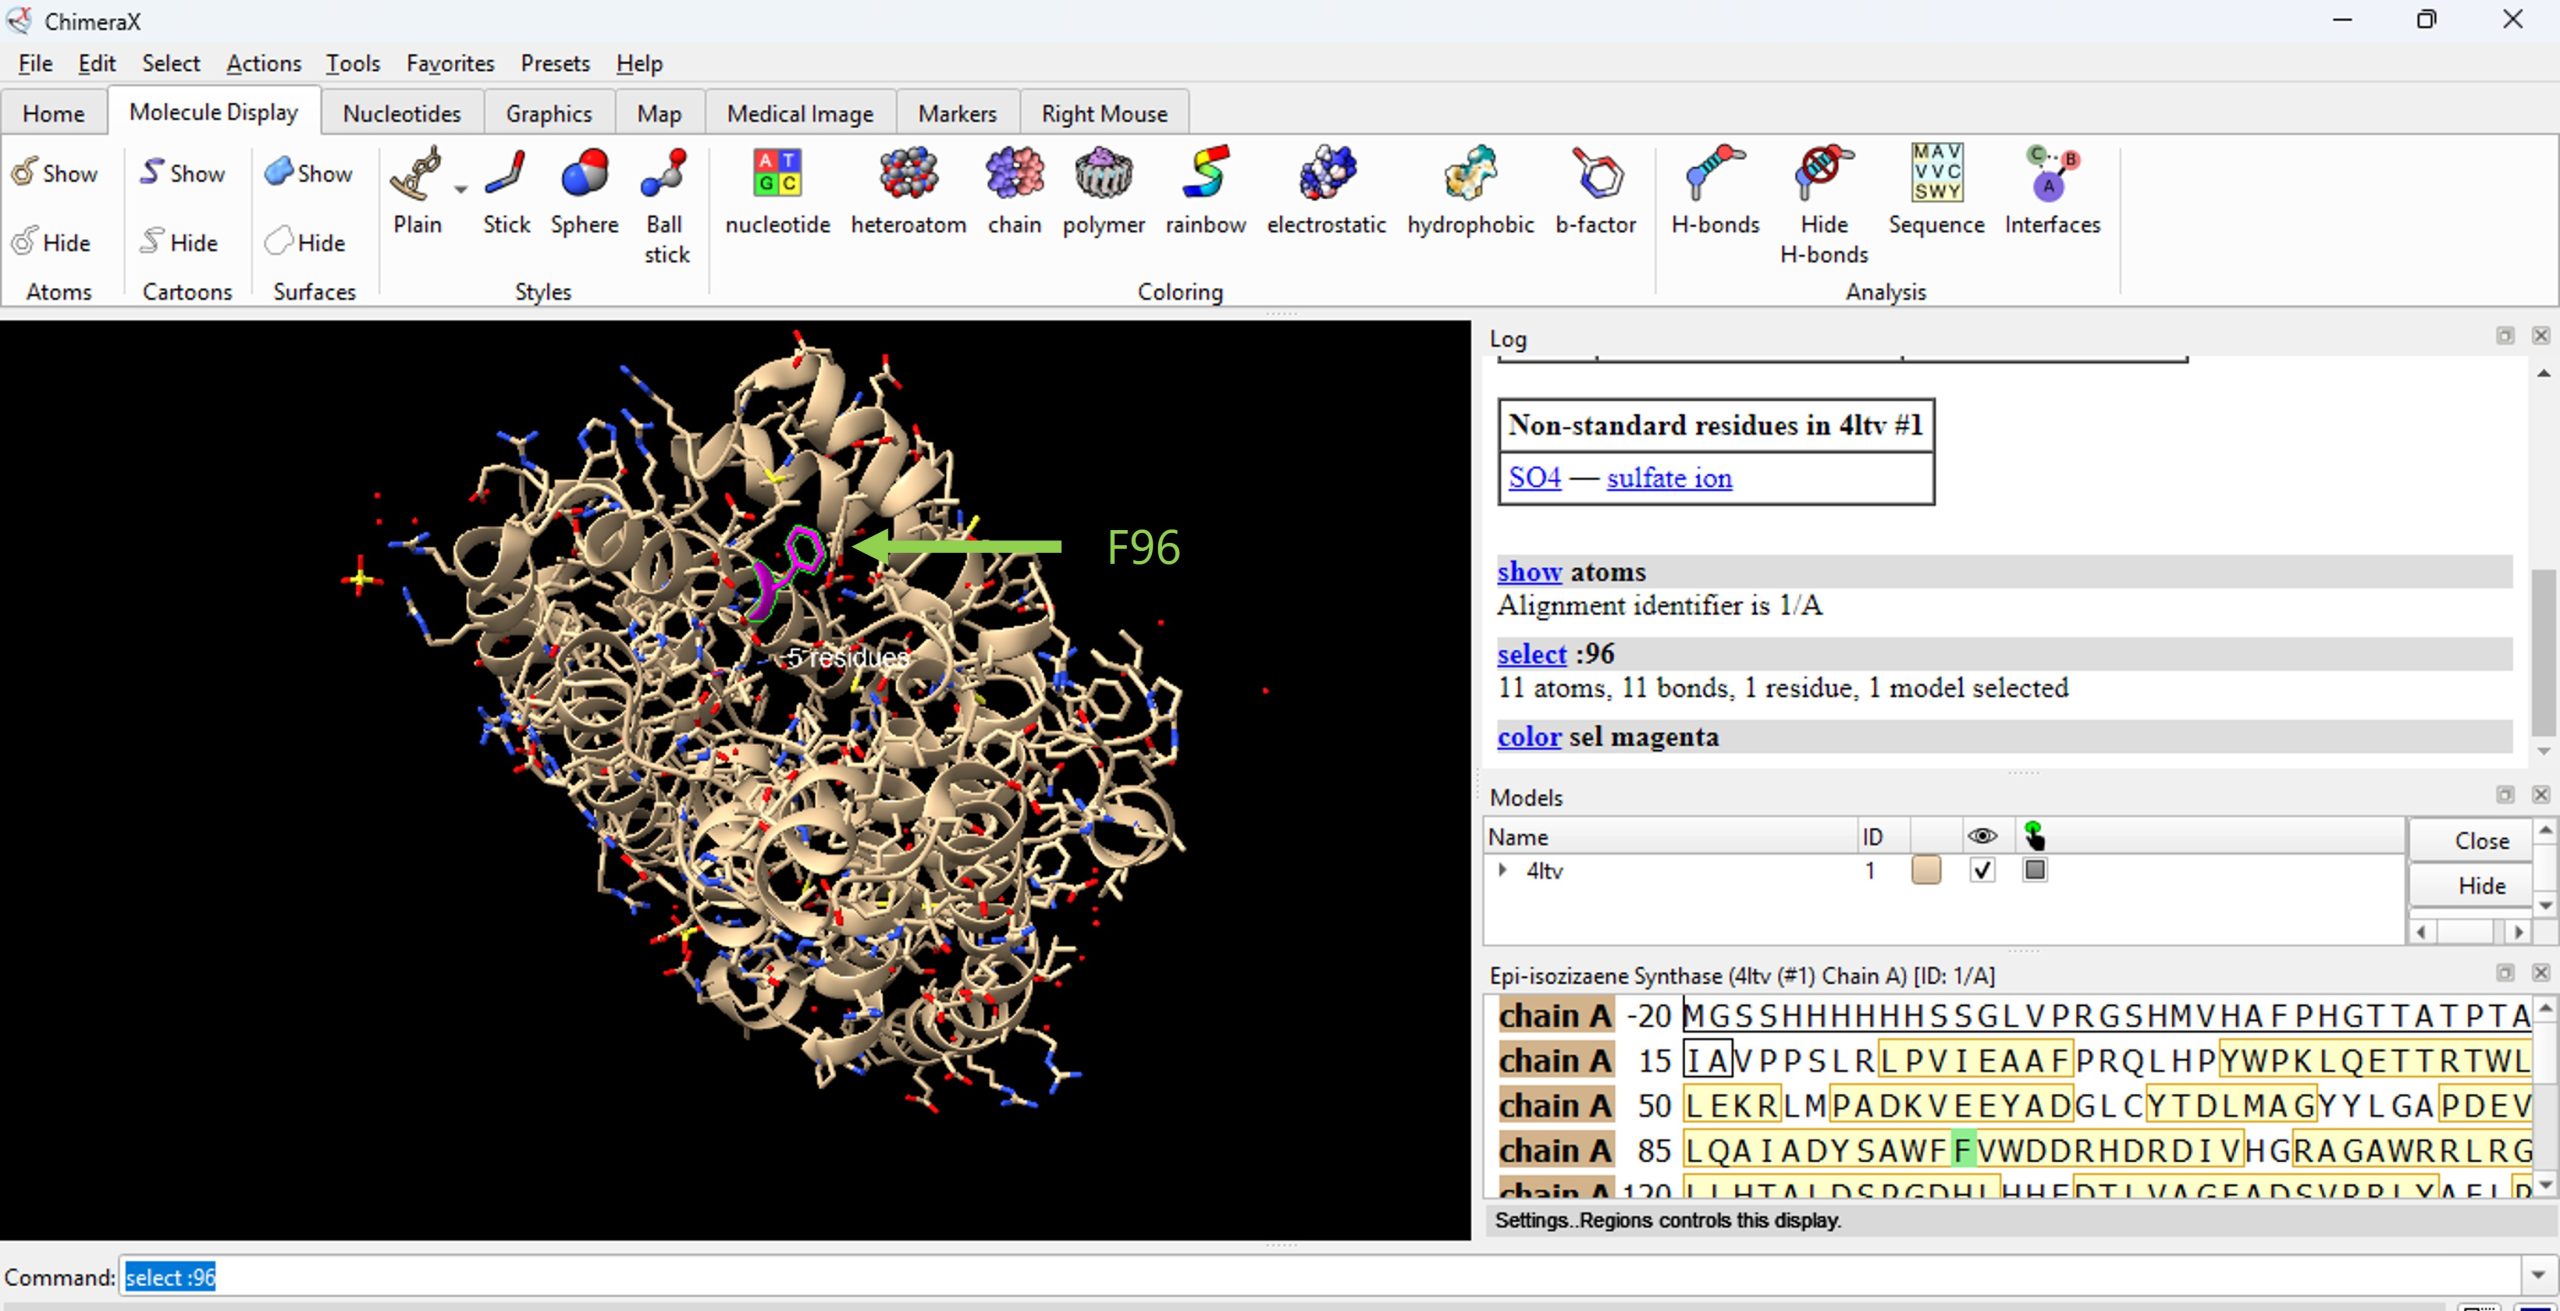 Figure 1: Changing the color of the amino acid residue that will be changed by mutagenesis.
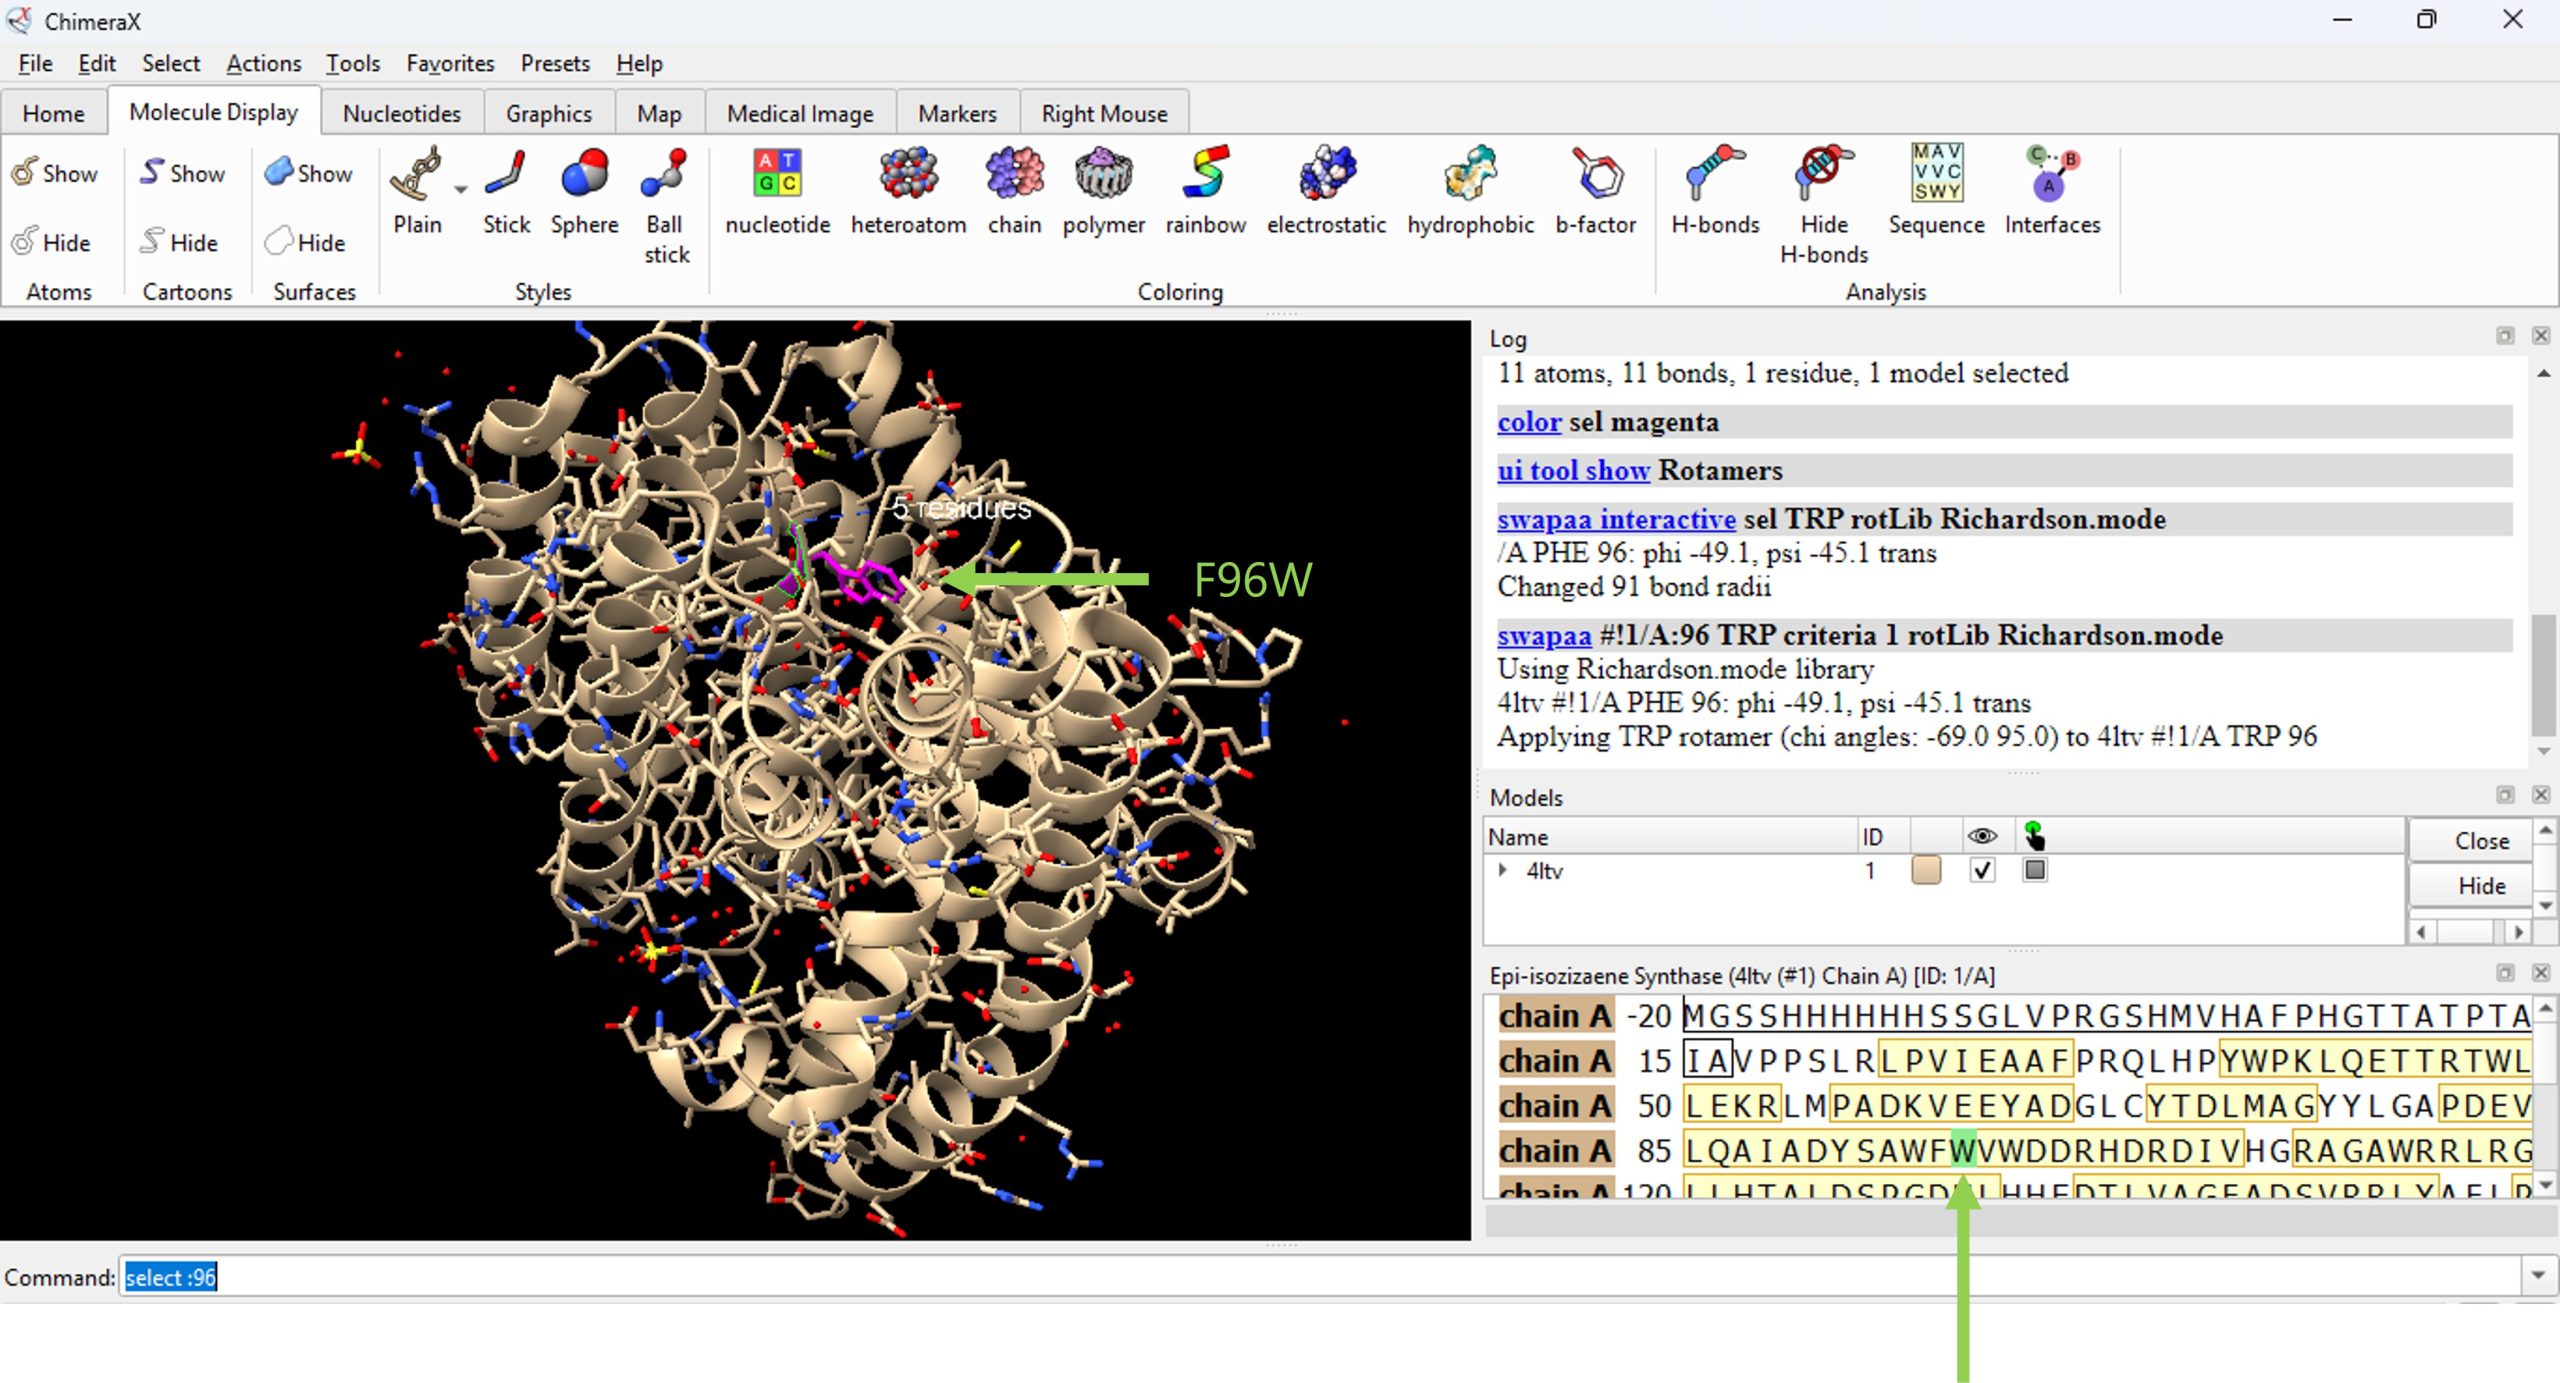
- For this example, the user will mutate (phenylalanine) F96 to (tryptophan) W96, yielding a F96W mutation.
- Mutate residue F96 by clicking: Tools → Structure Editing → Rotamers.
- In the pop up box, select Rotamer library Richardson (mode) and Rotamer Type TRP.
- Click ‘Apply’.
- A pop up box will appear with a table of possible rotamers for this mutation. For this example, select the top choice. (Figure 2), then click on ‘Use Chosen Rotamer(s).
The result for the F96W mutation is shown in Figure 3.
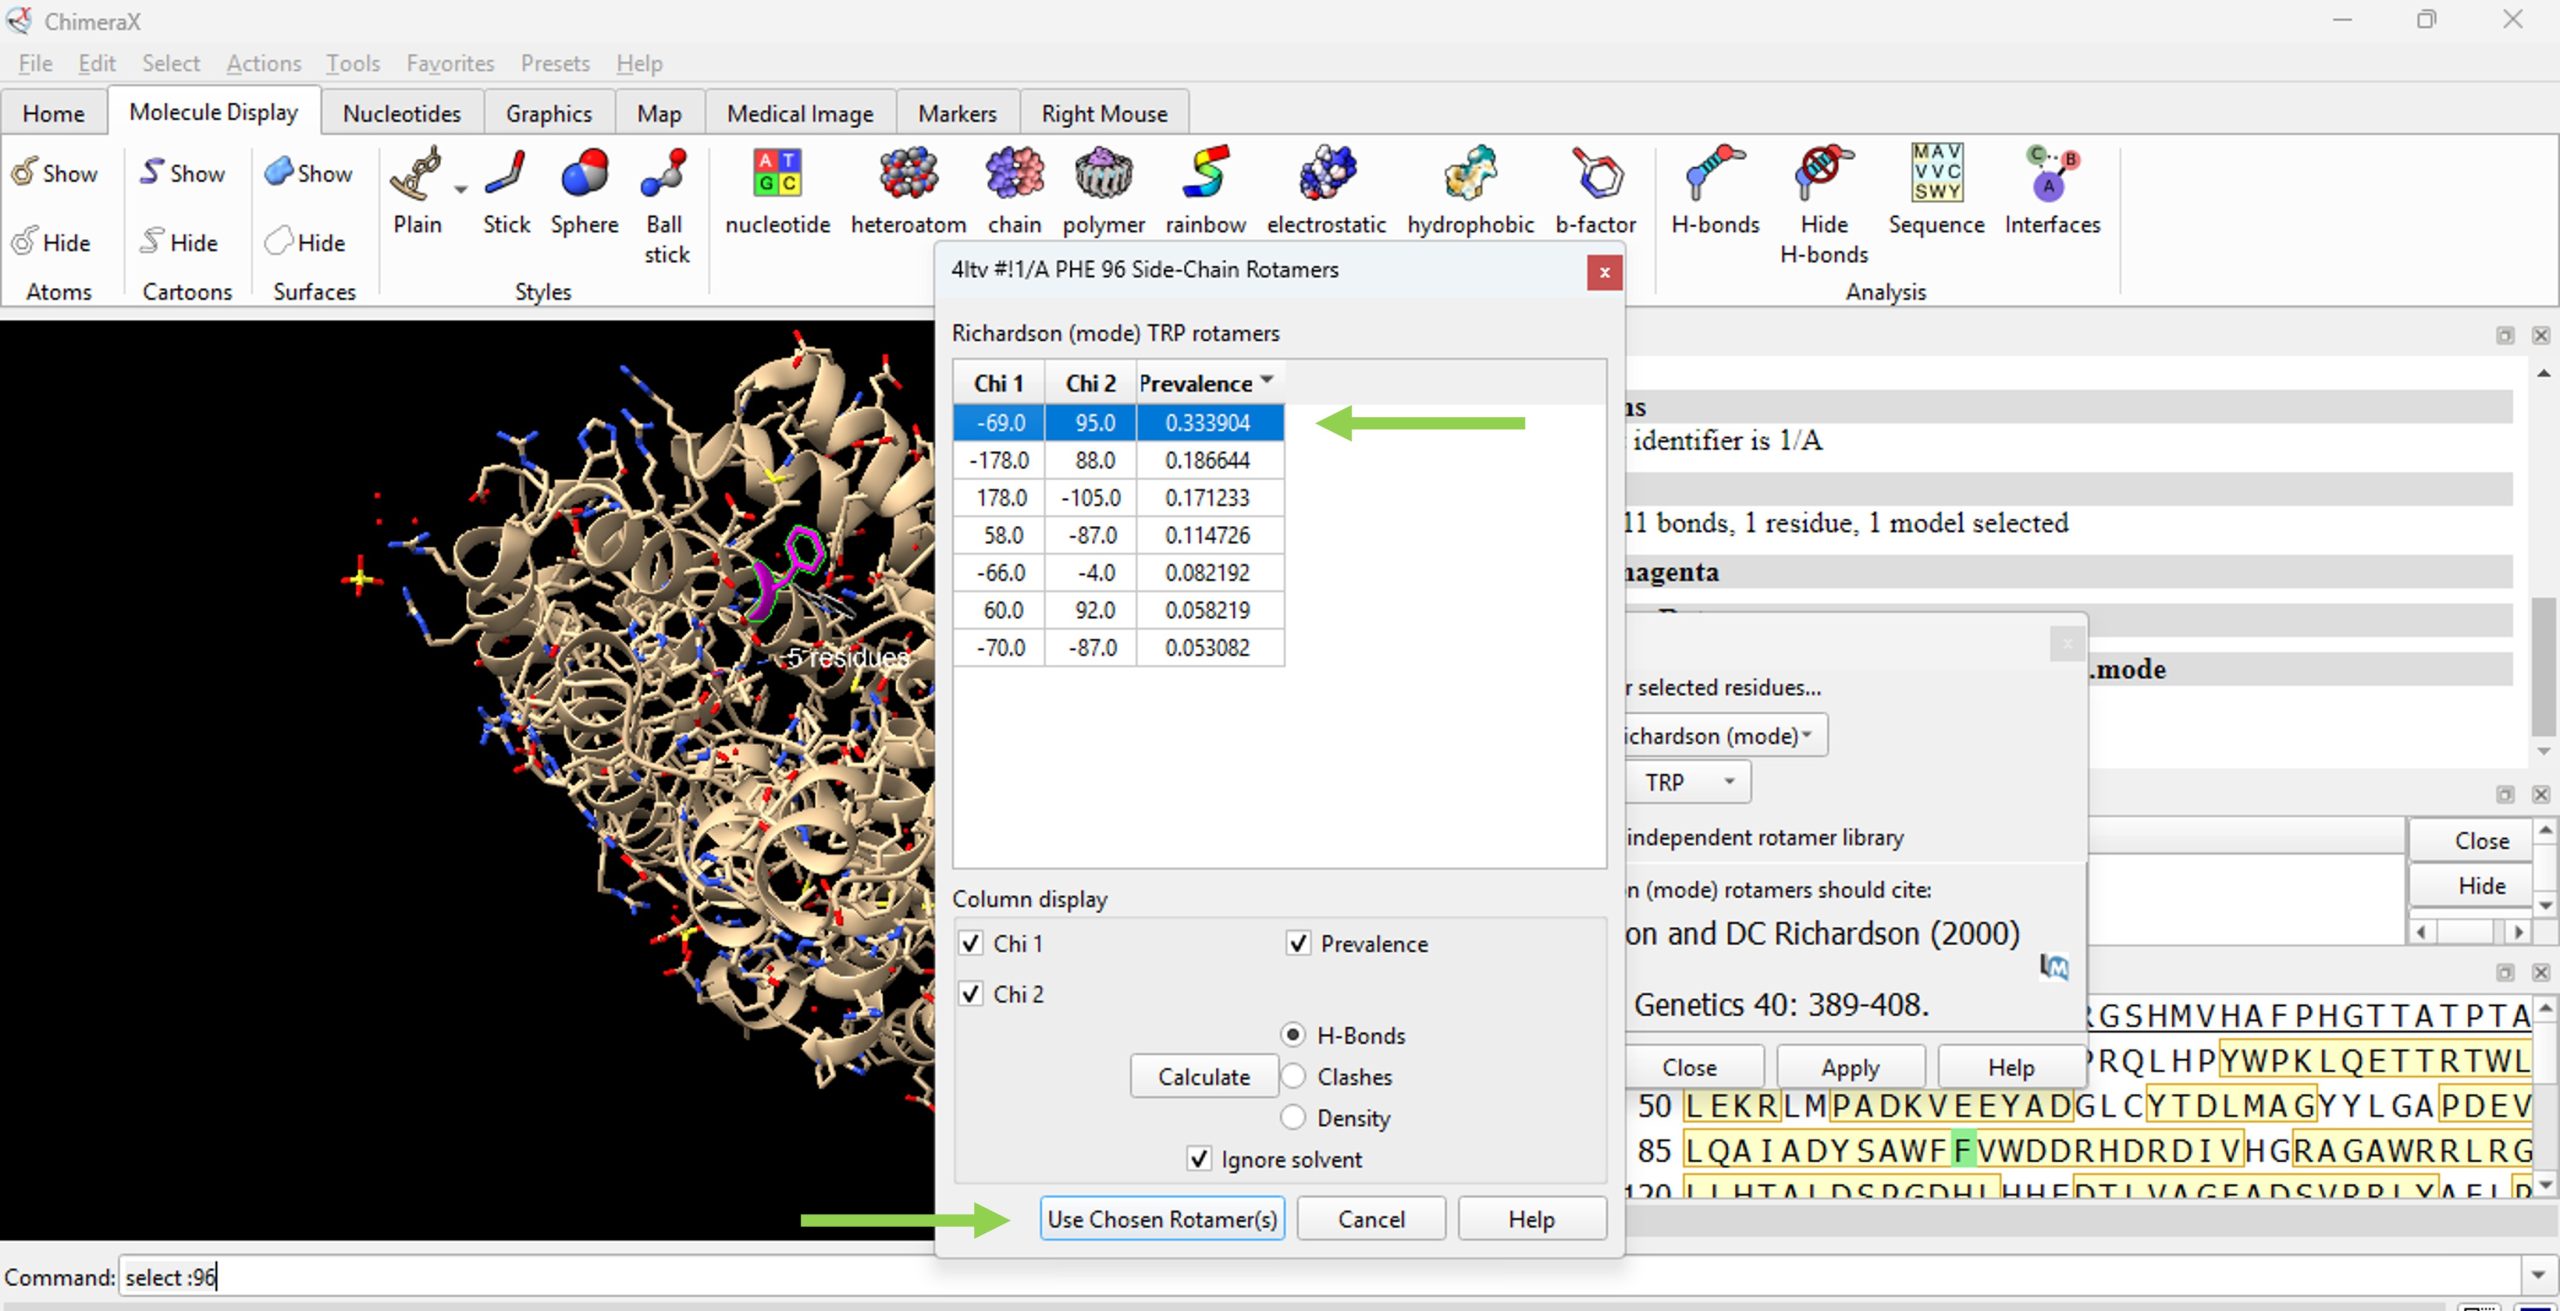 Figure 2: View of the rotamer selection table from rotamer library
Visualizing change in active site pocket due to mutagenesis
Note: This set of steps will produce a mutation at a single amino acid residue in the protein and allow the user to visualize the difference in volume of the active site pocket for the mutant protein and the wild-type protein.
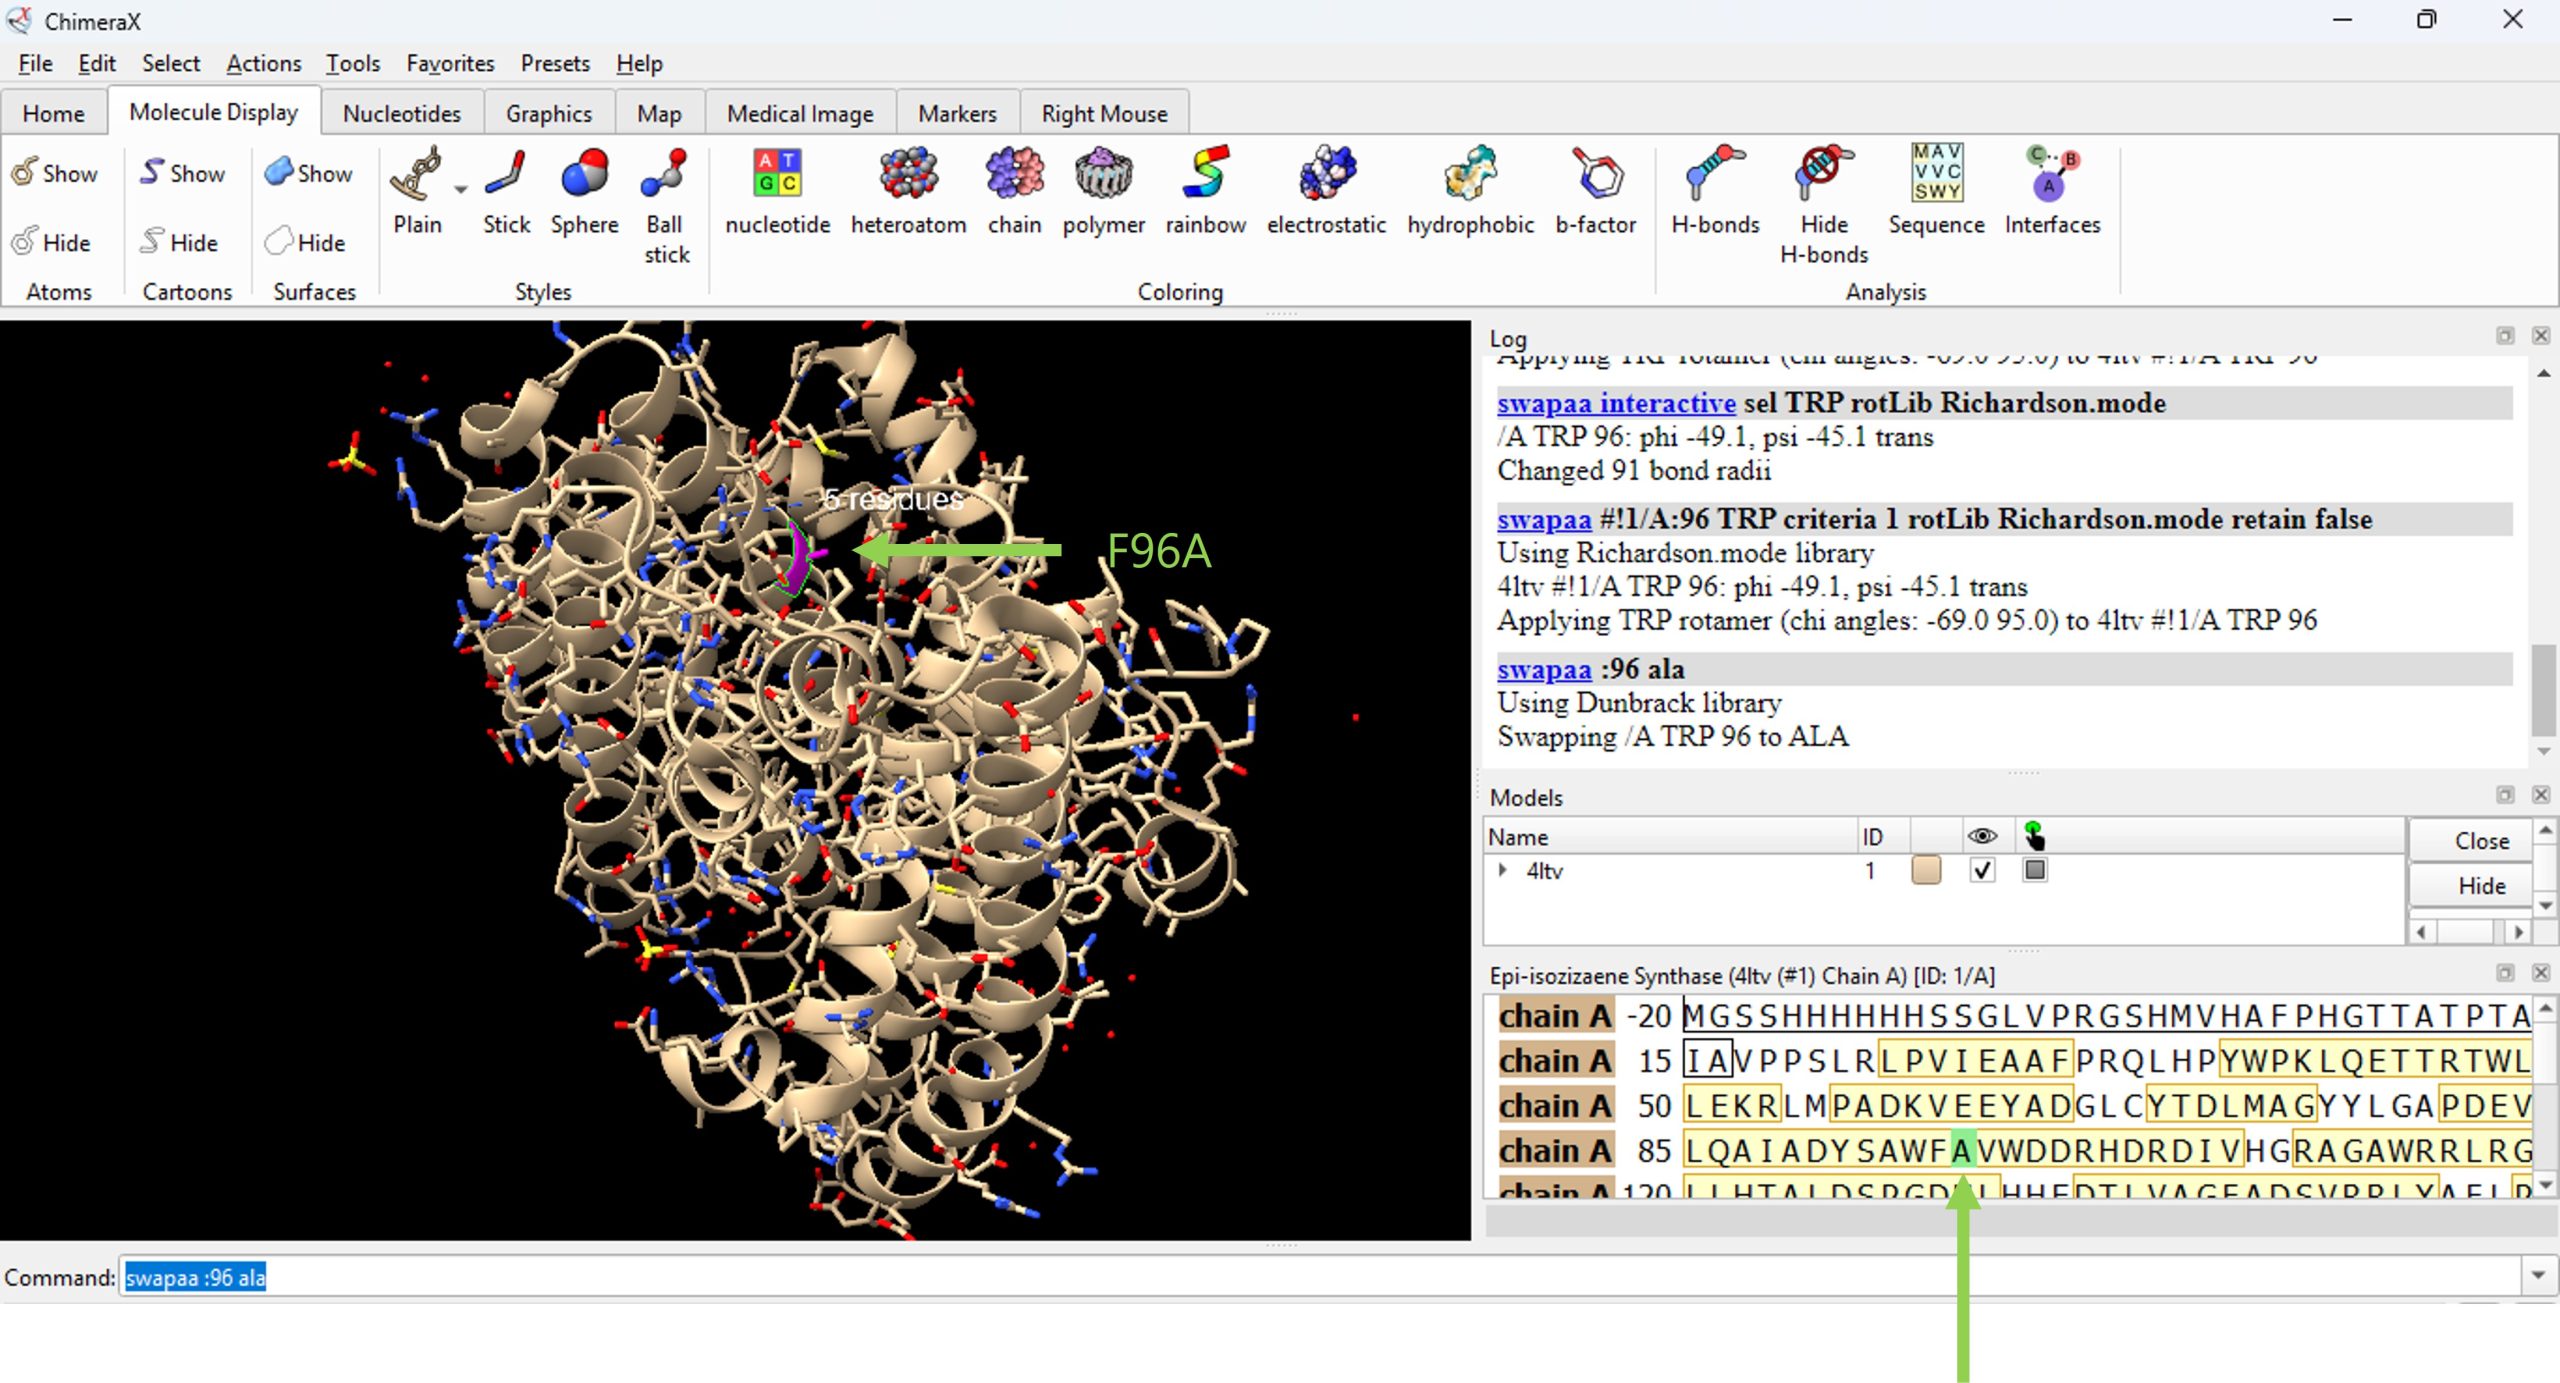
- Mutate residue 96 to alanine. Begin by typing in the command line, swapaa :96 ala (Figure 4).
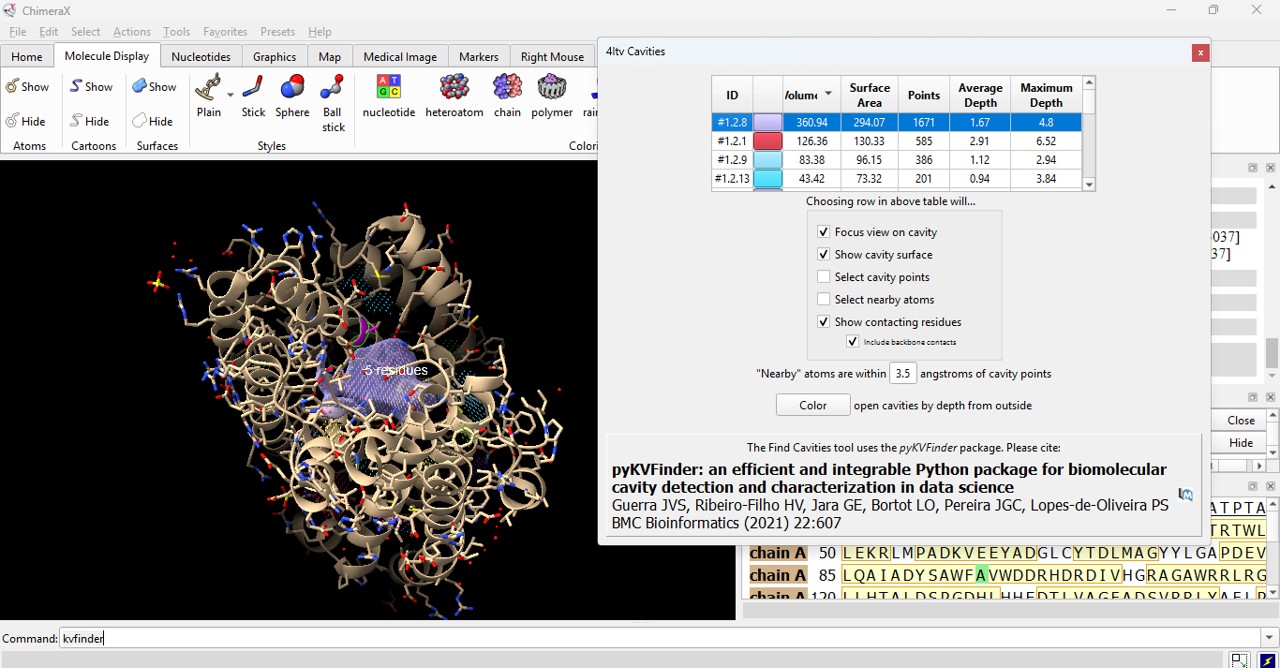
- To visualize the surface cavities of the protein, type into the command line kvfinder
The software is running the command to find the cavities within the protein and will generate a subsequent pop up with a clickable list of the available surface cavities. This may take a few moments (Figure 5).
Note: When you run cavity detection or other structure analysis tasks in ChimeraX, the software often uses command-line tools or scripts behind the scenes. The black box that the user may see is the Command Line Interface (CLI) or log console, which ChimeraX uses to:
- Execute commands: Even if you’re using the GUI, ChimeraX translates your actions into command-line instructions.
- Show output or errors: If there’s a warning, error, or status update (e.g., “cavity detection completed”), it appears here.
- Run external tools: Some cavity detection algorithms may invoke Python scripts or compiled binaries, which briefly open a terminal window.
C
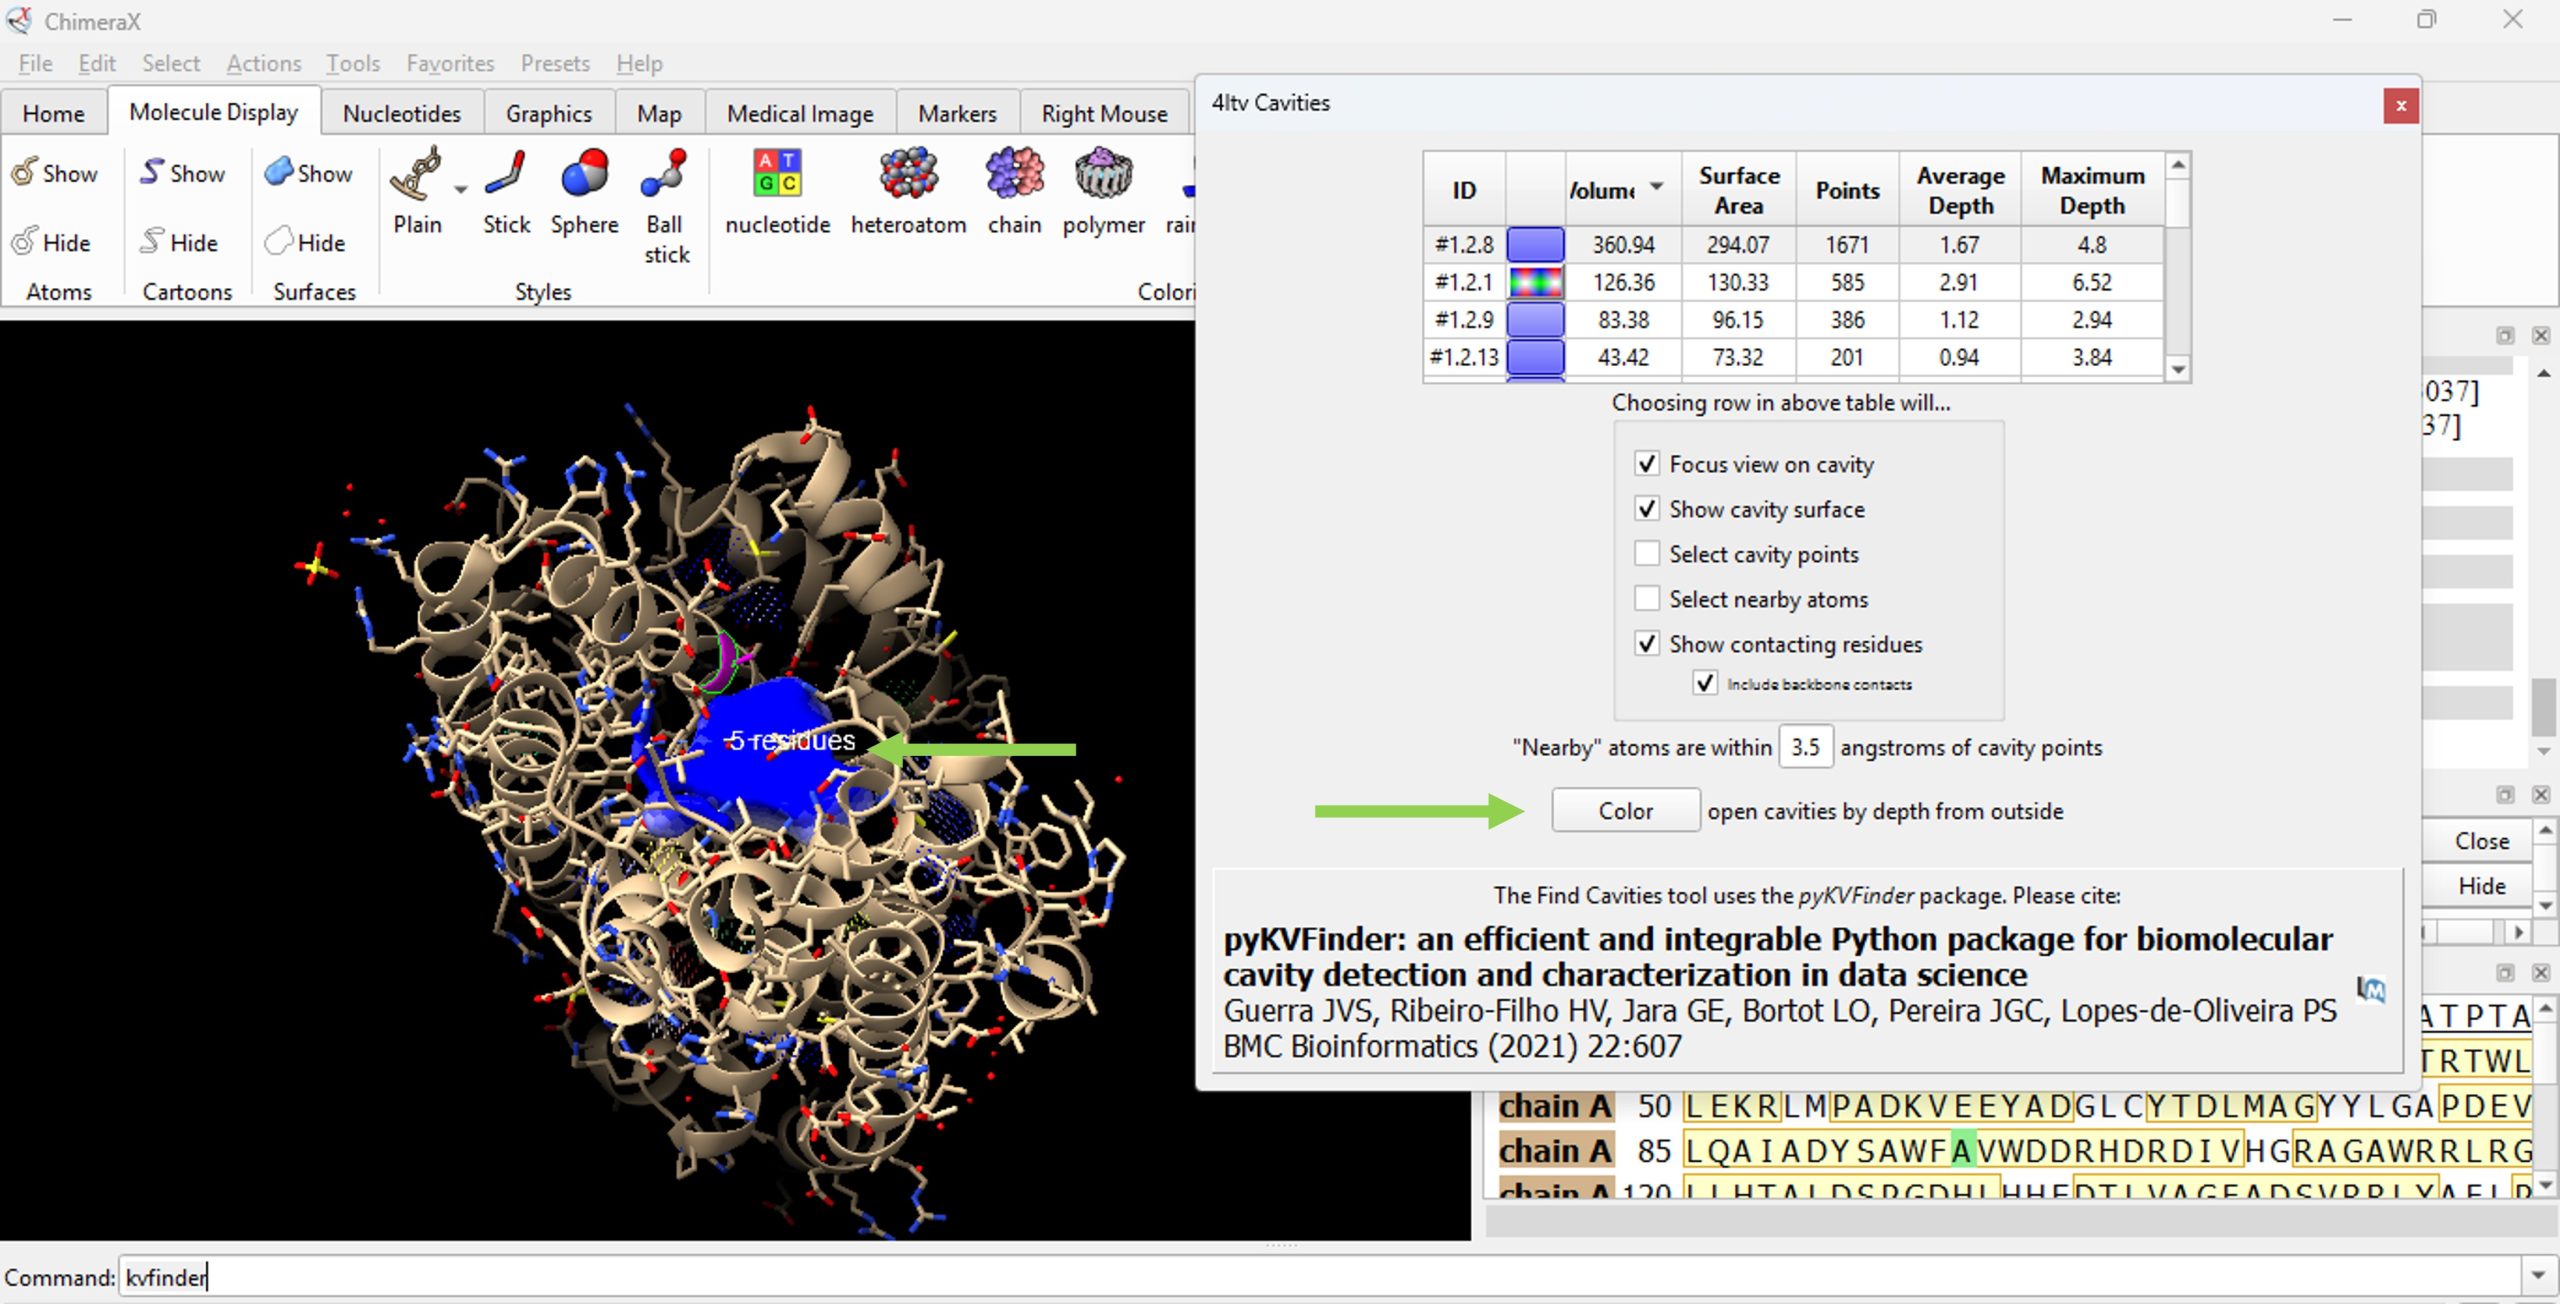
14. Click on the ID# within the surface cavity table to identify the cavity of interest on the molecule. For this example, click on top ID#, if sorted from highest volume to lowest volume (Figure 5).
Note: Select ‘Color open cavities by depth from outside’ to deepen the color of the cavity for enhanced contrast of the cavity selection (Figure 6).
Record
15. Record its volume and surface area (as found in the table). The user should have recorded 360.94 for the volume and 294.07 for the surface area for the F96A protein.
16. Now let’s compare the surface cavity pocket of this F96A mutation of the 4LTV protein to the wild type 4LTV.
17. Reopen the wild type 4LTV molecule.
18. Show the side chains by selecting: (from the top menu) Molecular Display → Atoms → Show.
15.
19. Display the amino acid sequence by selecting: (from the top menu) Molecular Display → Analysis → Sequence.
20. Identify residue F96. In the command line, type select :96
21. Then color residue F96 by selecting: Actions → Color → Magenta (or select preferred color scheme).
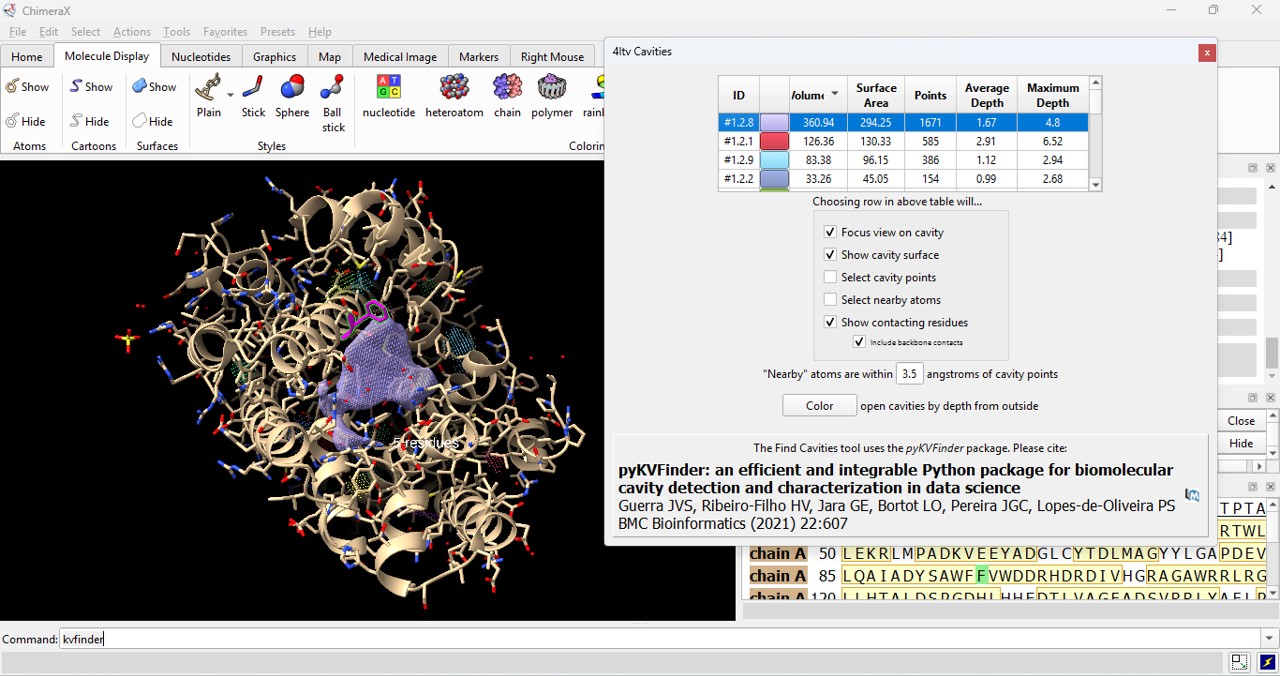
22. To visualize the surface cavities of the protein, type into the command line kvfinder
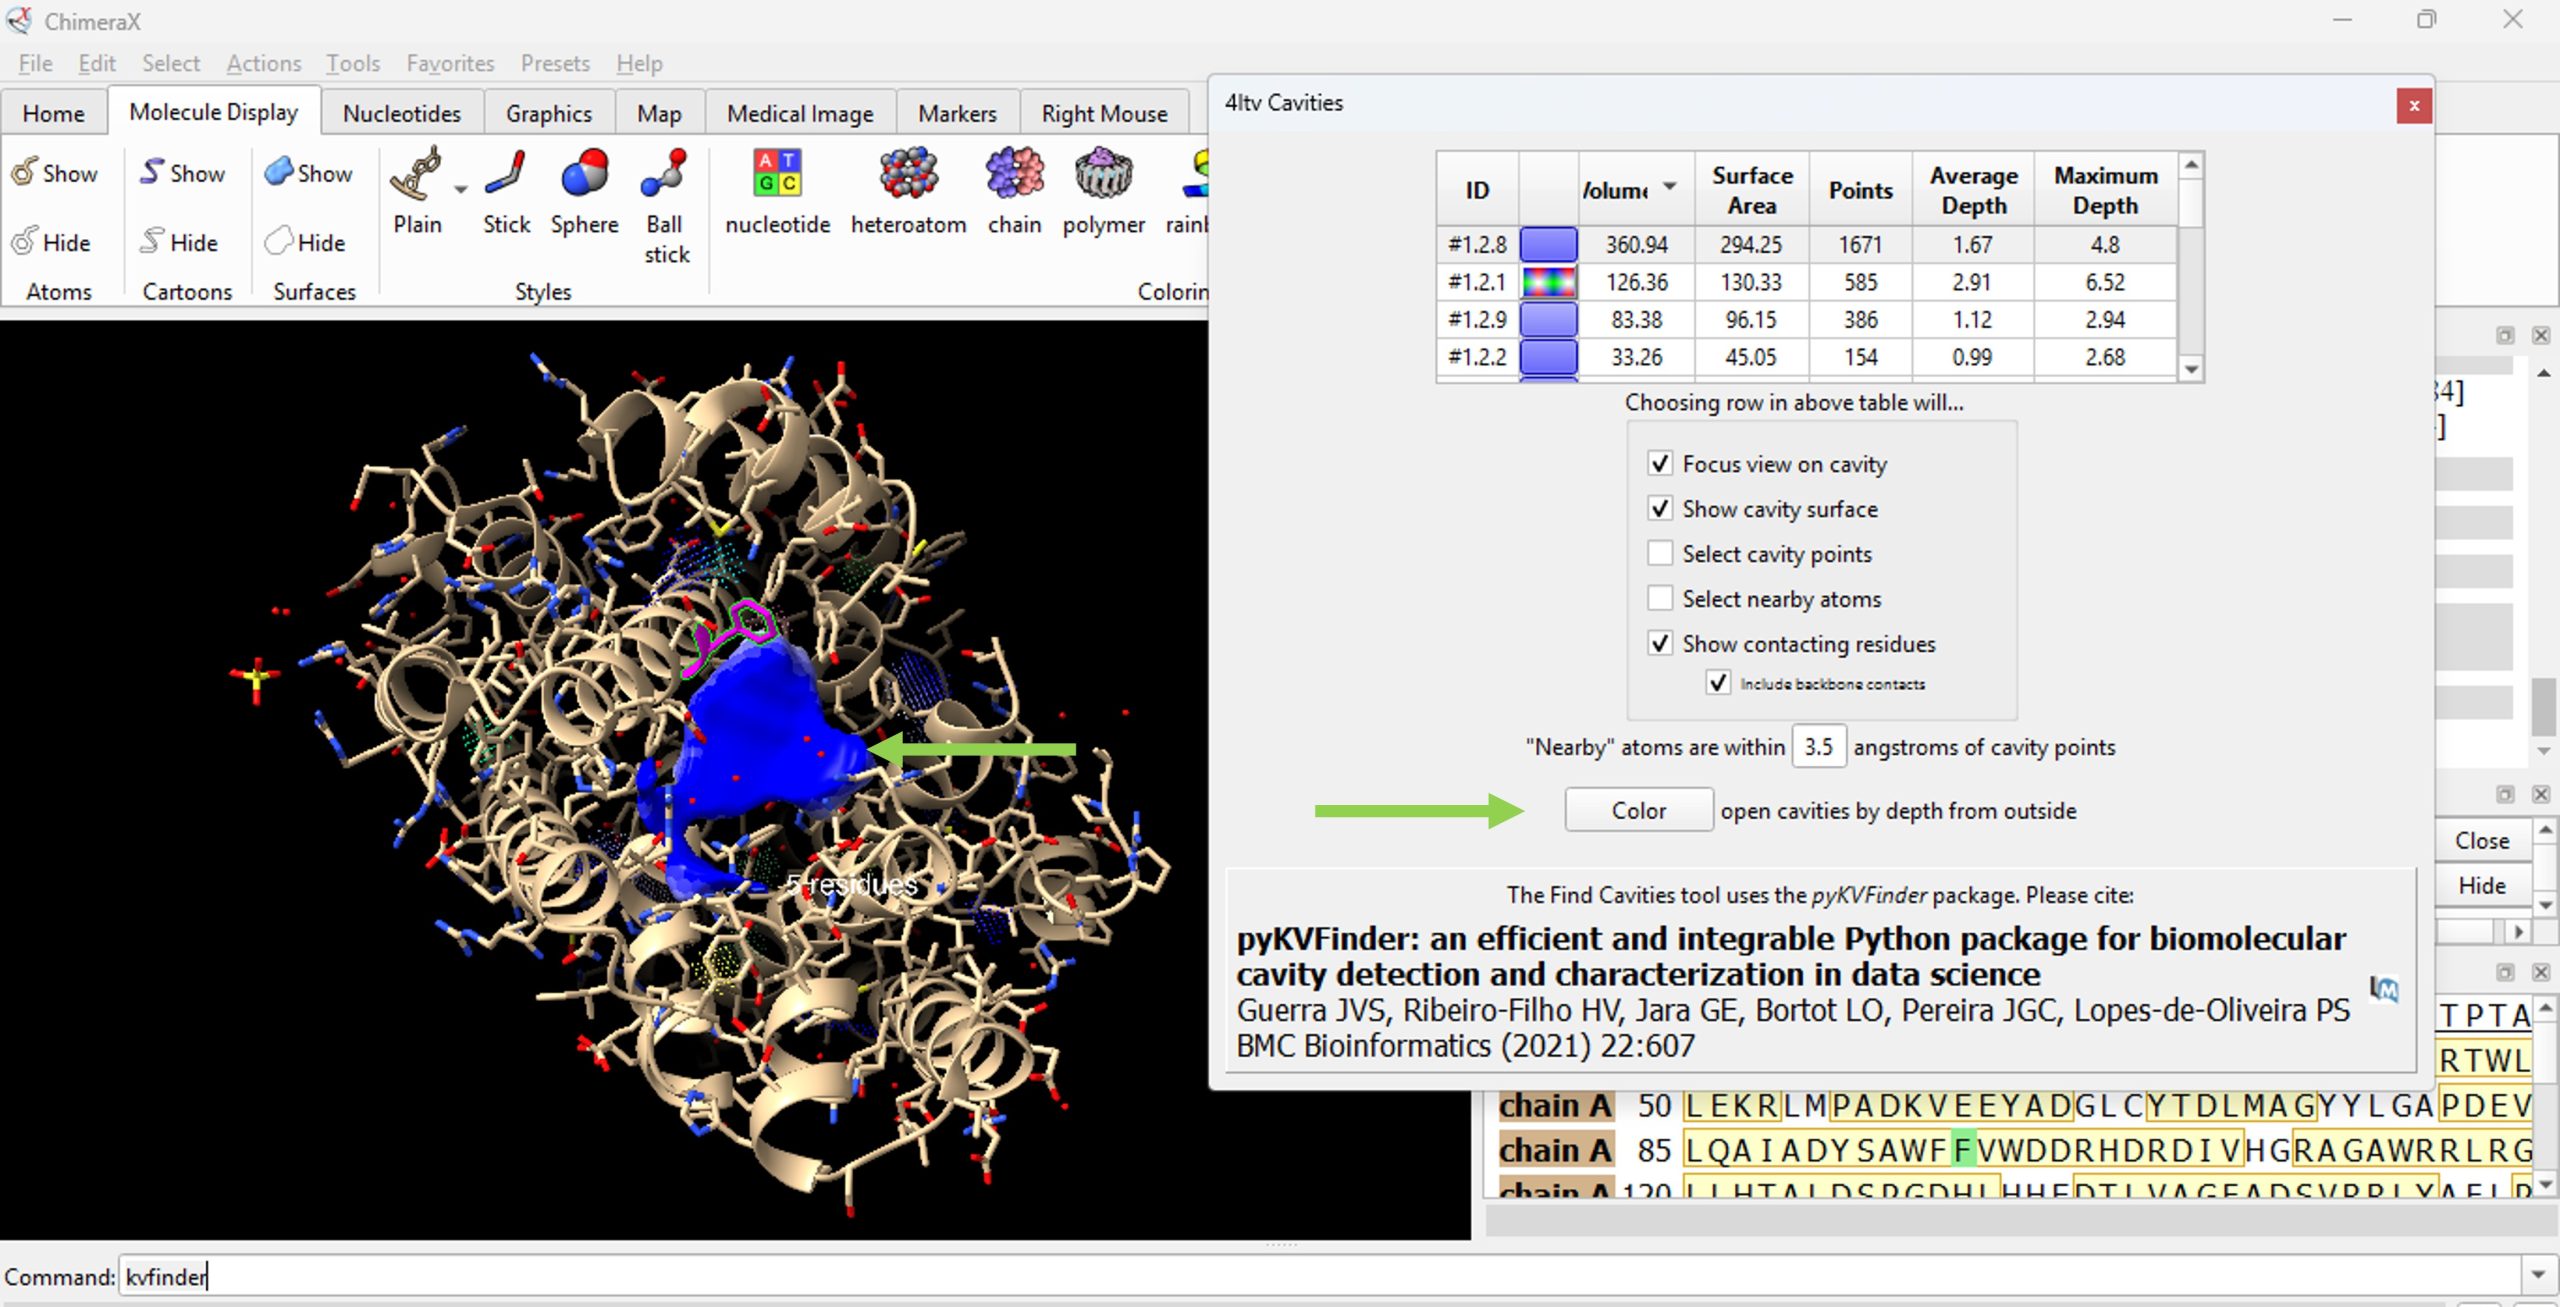
23. Click on the ID# within the surface cavity table to identify the cavity of interest on the molecule. For this example, click on top ID#, if sorted from highest volume to lowest volume. Select ‘Color open cavities by depth from outside’ to deepen the color of the cavity for enhanced contrast of the cavity selection (Figure 7). Select ‘Color open cavities by depth from outside’ to deepen the color of the cavity for enhanced contrast of the cavity selection (Figure 8).
Reco
24. Record its volume and surface area (as found in the table).
- The user should have recorded 360.94 for the volume and 294.25 for the surface area for the WT (F96) protein.
- In contrast, the F96A protein was 360.94 for the volume and 294.07 for the surface area, representing a slight difference in surface area.