
IX.A. ChimeraX Manual Measurement
Walter Novak and Josh Beckham
Overview: This activity demonstrates how to manually measure distances.
Outcome: The user will be able to measure and label distances between two atoms (e.g., from an atom in a ligand to an atom in the enzyme active site).
Time to complete: 15 minutes
Modeling Skills
- Selecting objects using the command line
- Selecting groups within 5 Angstroms, saving selections
- Manually measure distances between atoms (e.g., from a ligand to an active site amino acid residue)
About the Model
PDB ID: 1eve
Protein: Acetylcholinesterase
Activity: hydrolyzes the neurotransmitter acetylcholine to form acetate and choline
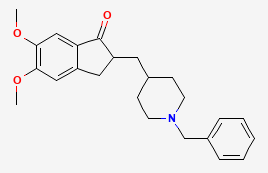
Description: single chain, bound to the drug Aricept (donepezil), covalently bound to five NAG glycan molecules
Steps
- Load 1eve: In the command line, type: open 1eve
- Select Aricept (residue name E20) and create an active site using the command line.
a) First, start with a clean slate. Hide the pre-rendered residues by typing in the command line: hide
b) Use the command line to select and display the active site (hit return after each line):
sel zone :e20 5 extend true residues true
show sel
col :e20 light sea green
col :e20 byhet
- Zoom in on the active site by clicking: Actions → Focus.
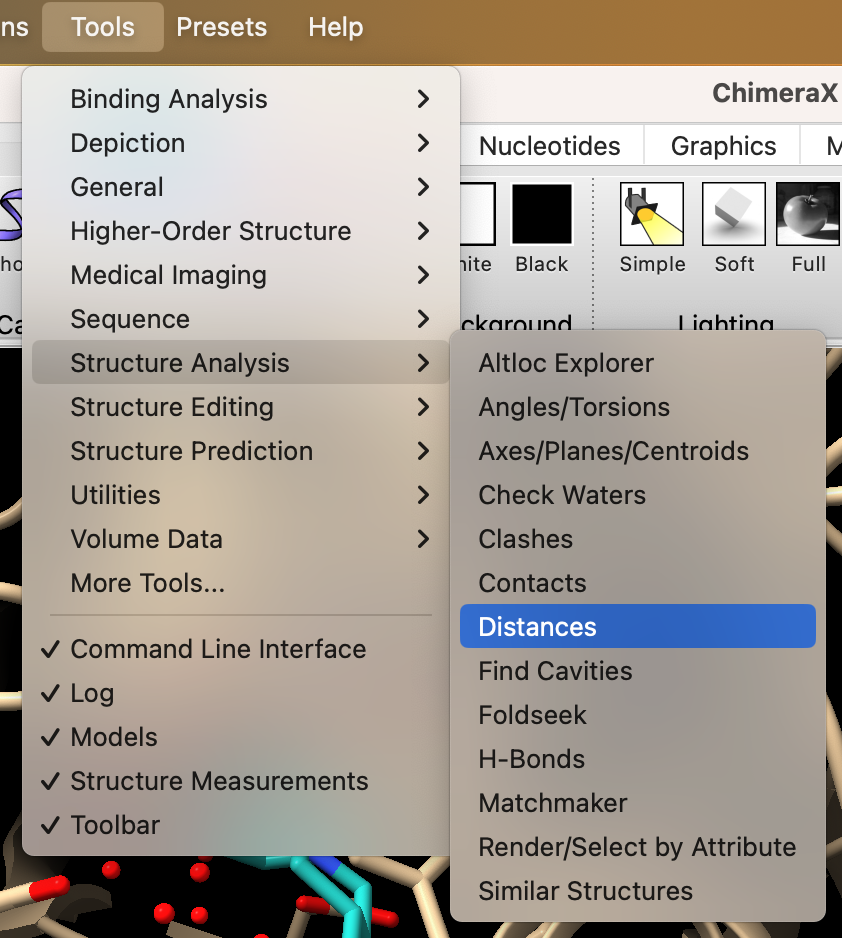
- In the dropdown menu: Tools → Structure Analysis → Distances (Figure 1).
- To measure distances:
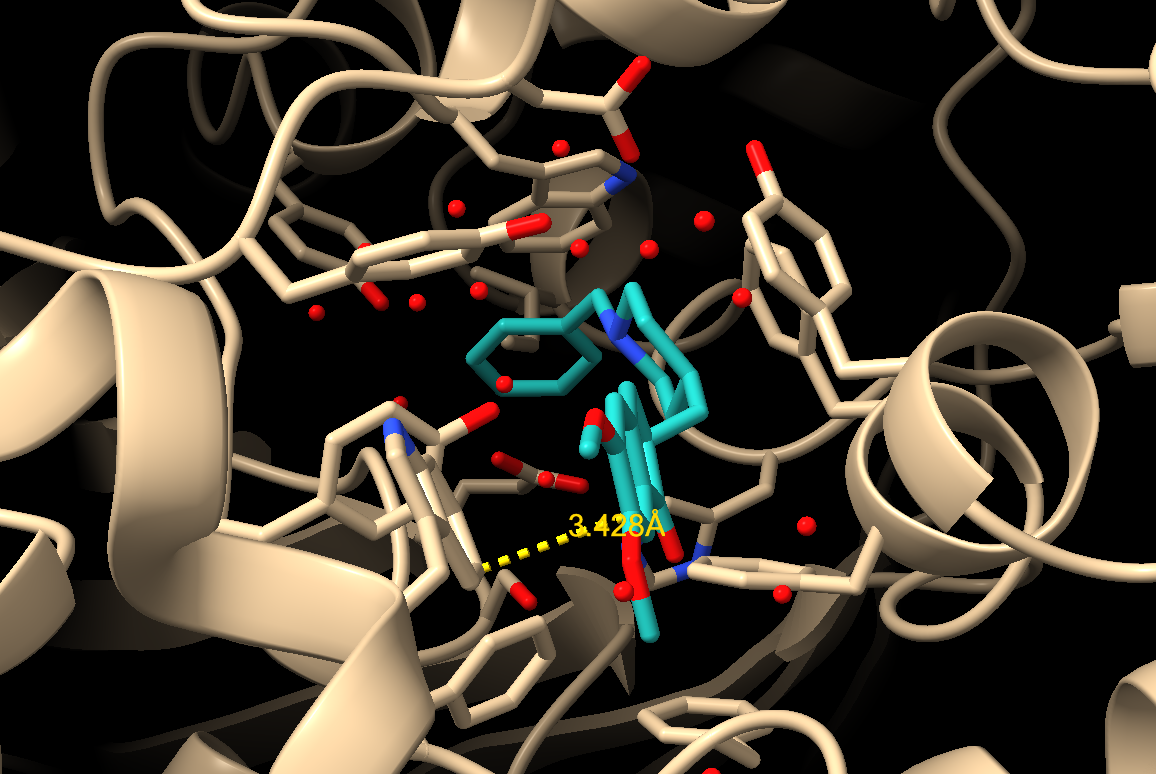
a) Ctrl+click on one atom in an aromatic ring of Aricept, which are located at either end of the molecule (Figure 2).
b) Next Ctrl+shift+click on a second atom in the protein nearby. Note: the Atom 1 and Atom 2 won’t show up yet in the “Structure Measurements” box that appears in the command log.
c) Then to create the distance measurement, click “Create” in the Distances section of the “Structure Measurements” box (Figure 3). Note: Van der Waals interactions will range from about 3.8–4.2 Å.
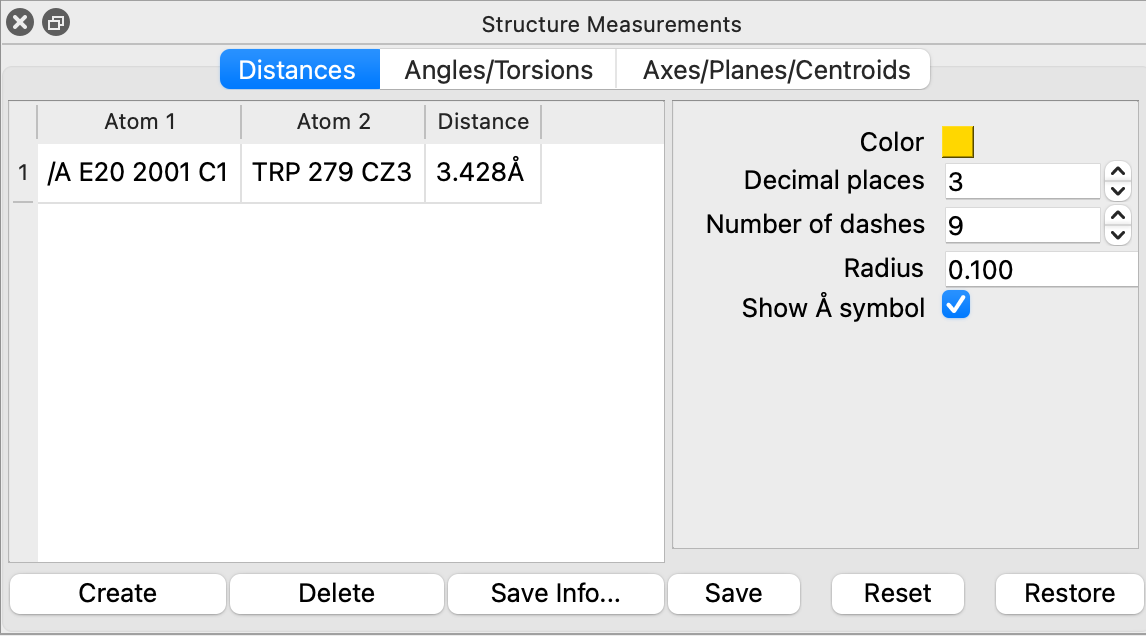
d) Unneeded measurements can be deleted, and useful measurements saved, as appropriate, using the list in the “Structure Measurements” box (Figure 3).
- (Optional) Save and close the session.
Note: Automatic Alternative
You can also identify contacts using the dropdown menu: Tools → Structure Analysis → Contacts.
By default it will identify all contacts, regardless of polarity.
To identify only nonpolar contacts, first use the selection dropdown menu to select all carbon atoms: Select → Chemistry → Element → C.
Then in the Contacts popup, ensure “Limit by selection” is checked and “with both ends selected.” “Include intramodel” should also be selected and “Include intramolecule” should be unchecked. Clicking “OK” should only identify nonpolar contacts.
The default settings can be reapplied by clicking the “Reset” button at the bottom of the popup.