
III.C. Mol* Molecular Surface/Properties
Didem Vardar-Ulu and Shane Austin
Overview: This chapter describes the application of coloring to help display molecular properties.
Outcome: The user will be able to display the molecular surface of a structure, apply a chemical property-based coloring scheme, and change transparency.
Time to complete: 10 minutes
Modeling Skills
- Display the Molecular Surface of Protein
- Molecular with different colors
- Electrostatic Potential
- Hydrophobicity
About the Model
PDB ID: 1XWW
Protein: Low molecular weight protein tyrosine phosphatase
Activity: hydrolyzes Tyr-OPO32- phosphoester bond
Description: single chain, bound SO42- competitive inhibitor, bound glycerol (nonspecific stabilizer)
Steps
Load the Structure:
- Go to rcsb.org
- In the search bar at the top, type: 1XWW and press Enter.
- On the landing page, click the “Structure” tab next to the highlighted “Structure Summary” tab to open the user interface and load the structure.
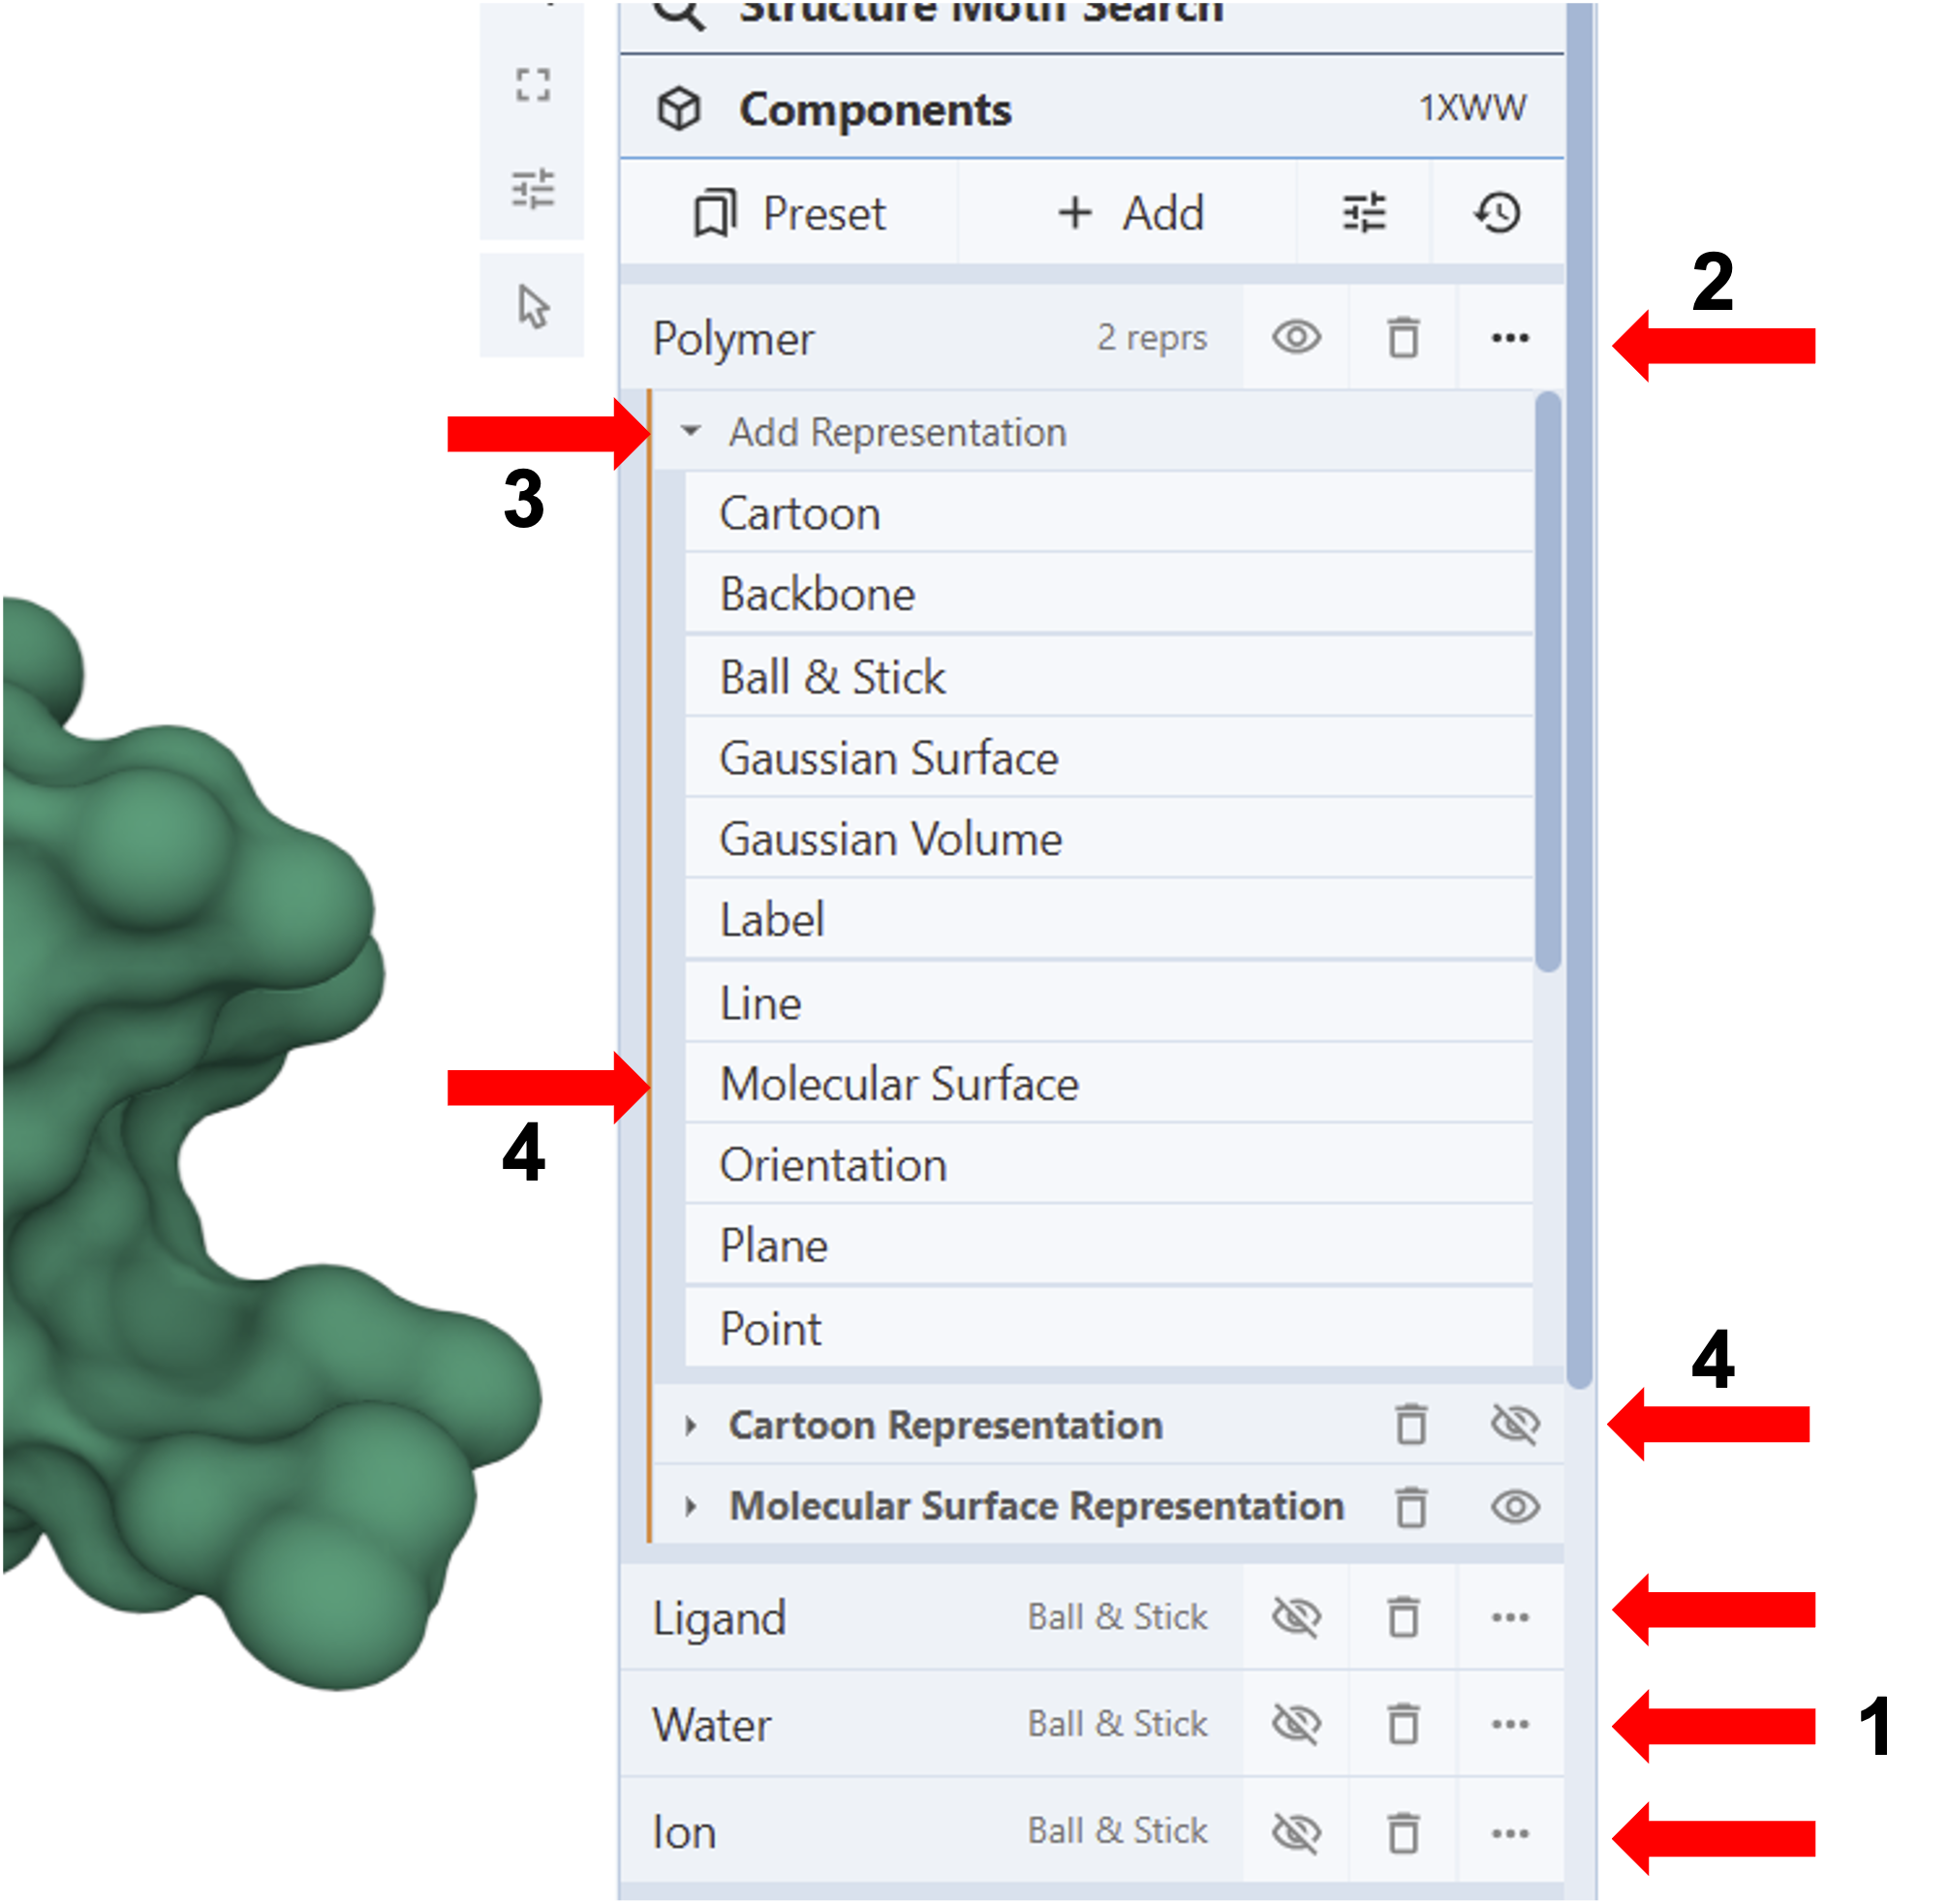
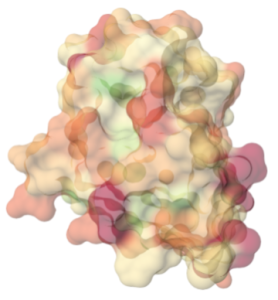
Show the Molecular Surface: (Figure 1)
-
-
-
-
-
-
-
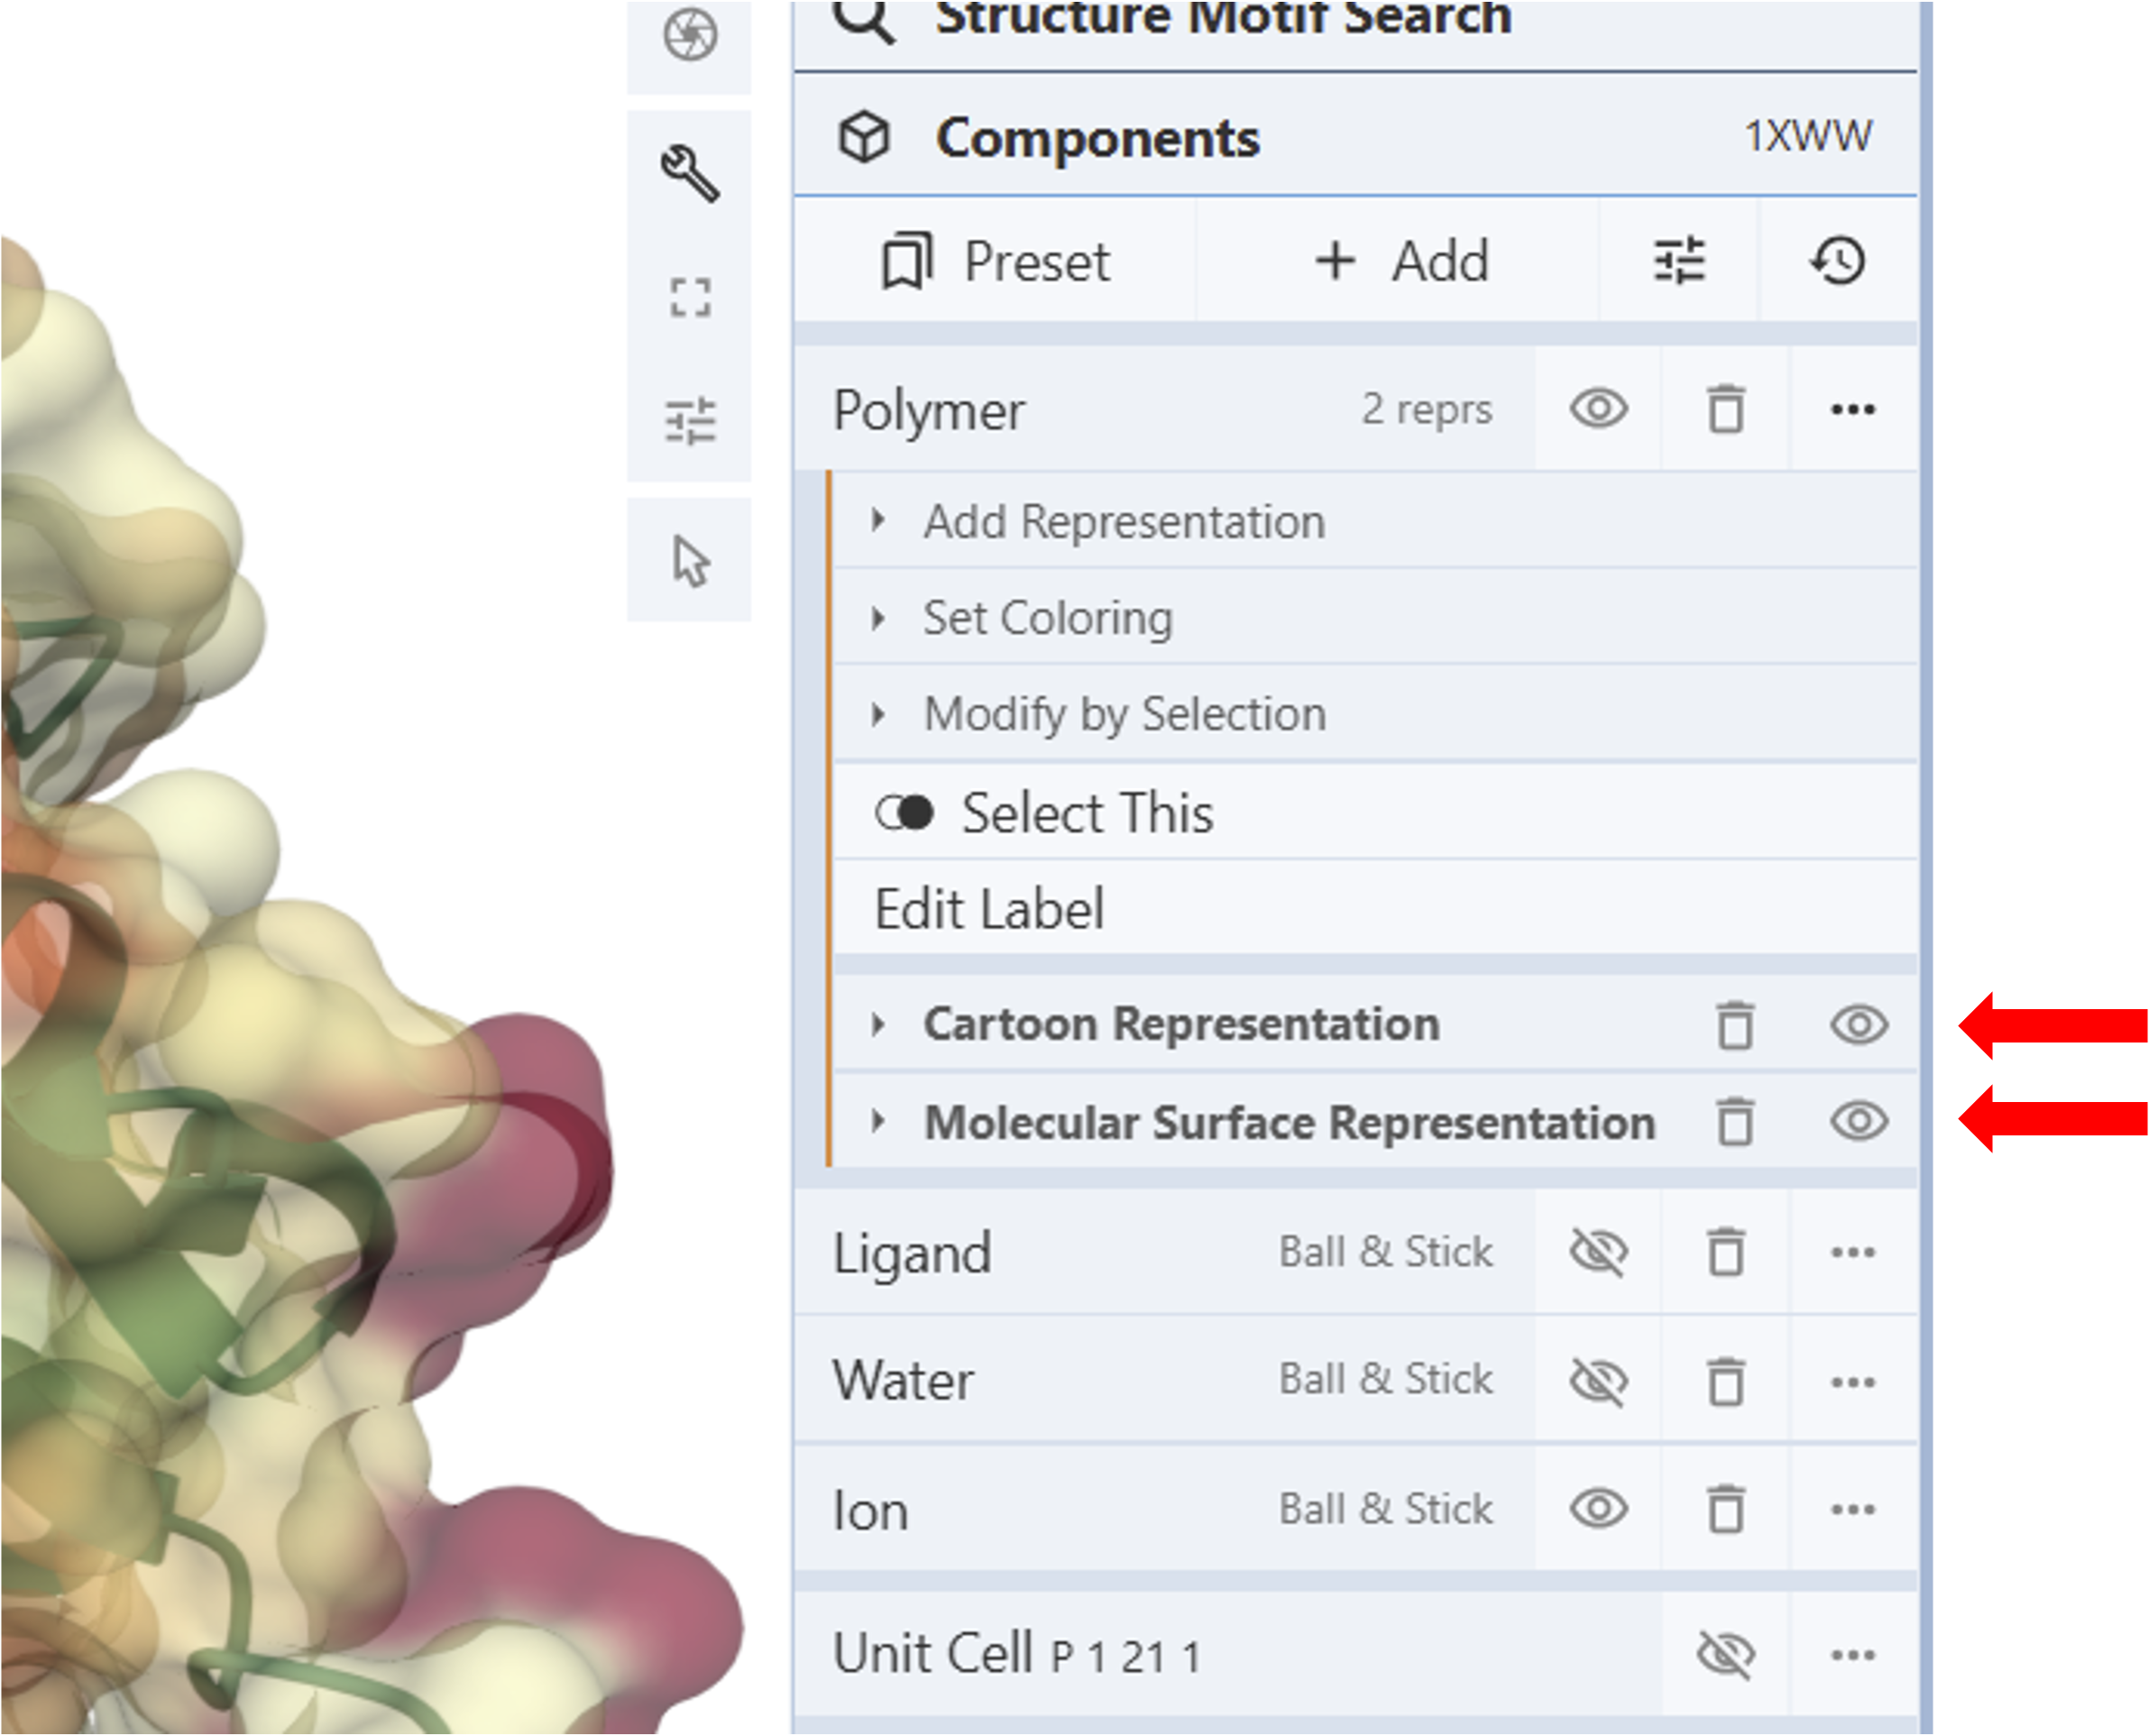
- To hide components in the Structure Panel that you do not want to see in the 3D Canvas view, such as “Ligand”, “Water”, and “Ion”, click the “eye” icon next to them (Arrows 1).
- Click on the three dots next to the component you want to modify (E.g., Polymer) (Arrow 2).
- Click “Add representation” (Arrow 3) to activate the drop-down menu with available representations.
Figure 2: Molecular Surface Representation of 1XWW - Click “Molecular Surface” to add it to the list of representations at the bottom of the panel for the component.
- Use the “eye icon” (Arrow 4) to hide the default “Cartoon Representation”.
- Collapse the dropdown menu by re-clicking “Add Representation” (Arrow 3).
-
-
-
-
-
-
Color the Molecular Surface (Figure 3)
Note: The default color theme is “Chain ID”. There are six color theme categories, each category has several preset coloring schemes that can be accessed by clicking the category name.
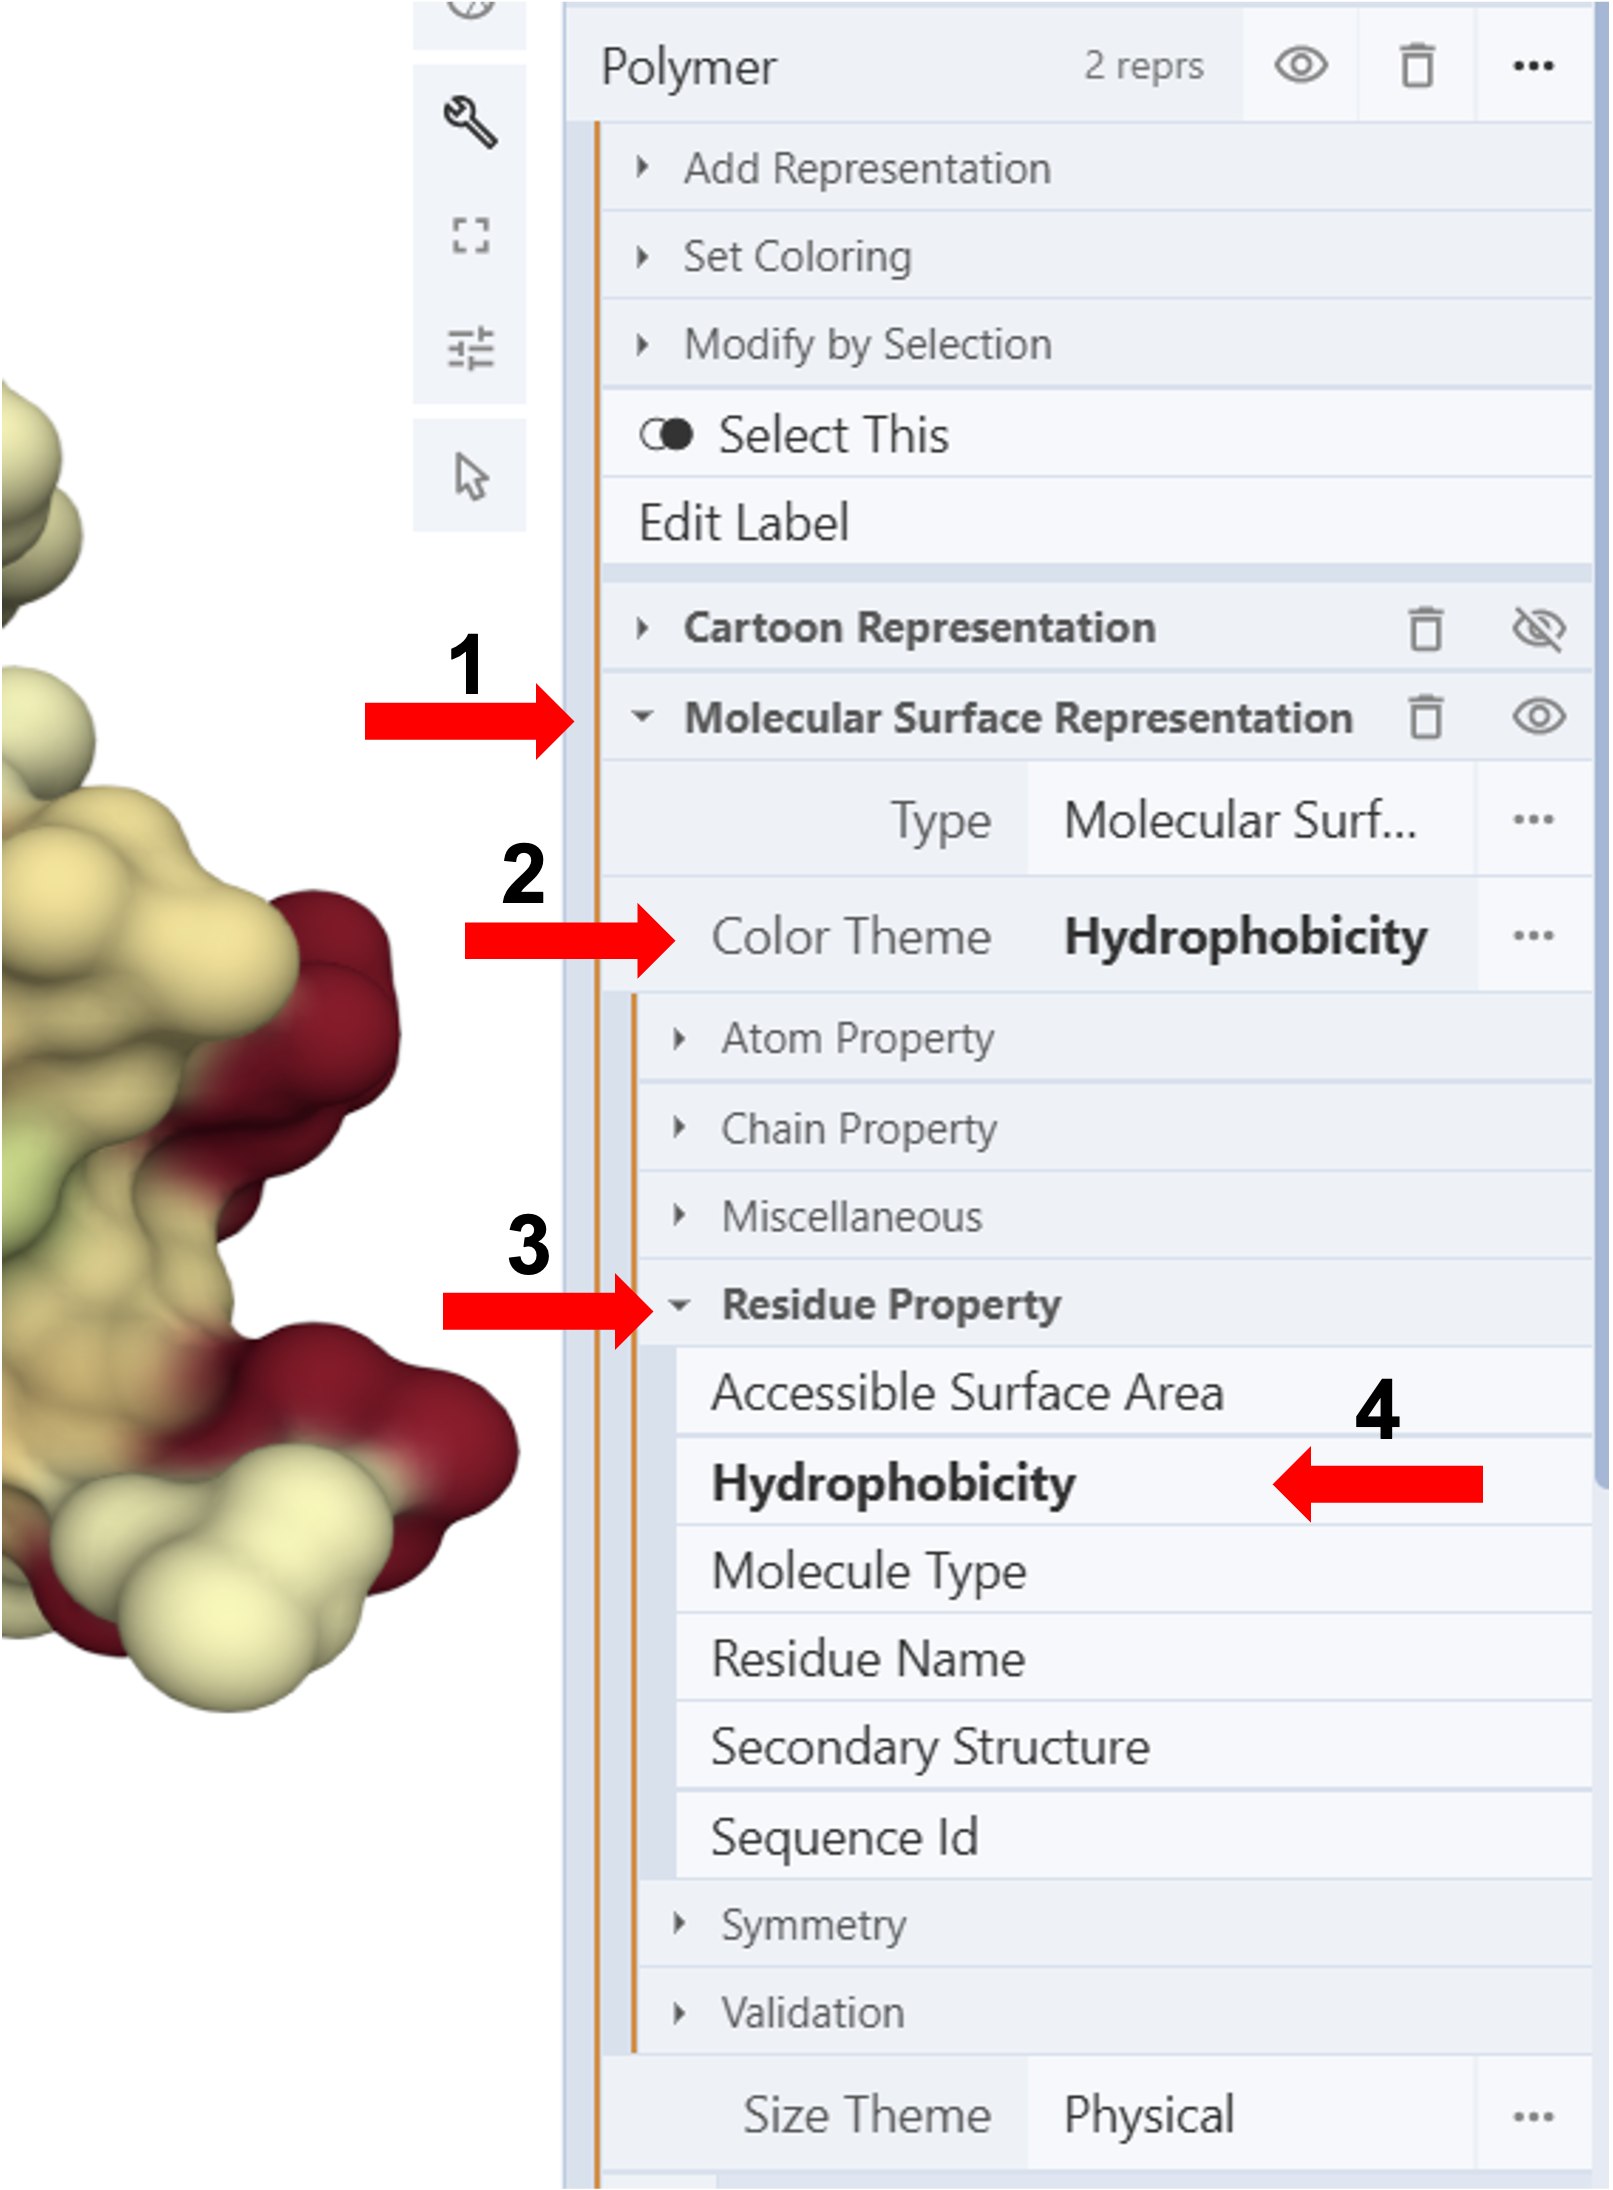
- Click “Molecular Surface Representation” to activate additional controls (Arrow 1).
- Click on the cell next to “Color Theme” to expand the menu (Arrow 2)
Coloring by hydrophobicity:
- Click “Residue property” to expand the menu. (Arrow 3)
- Click “Hydrophobicity.” (Arrow 4)
- Collapse the dropdown menu by re-clicking the cell next to “Color Theme” (Arrow 2)
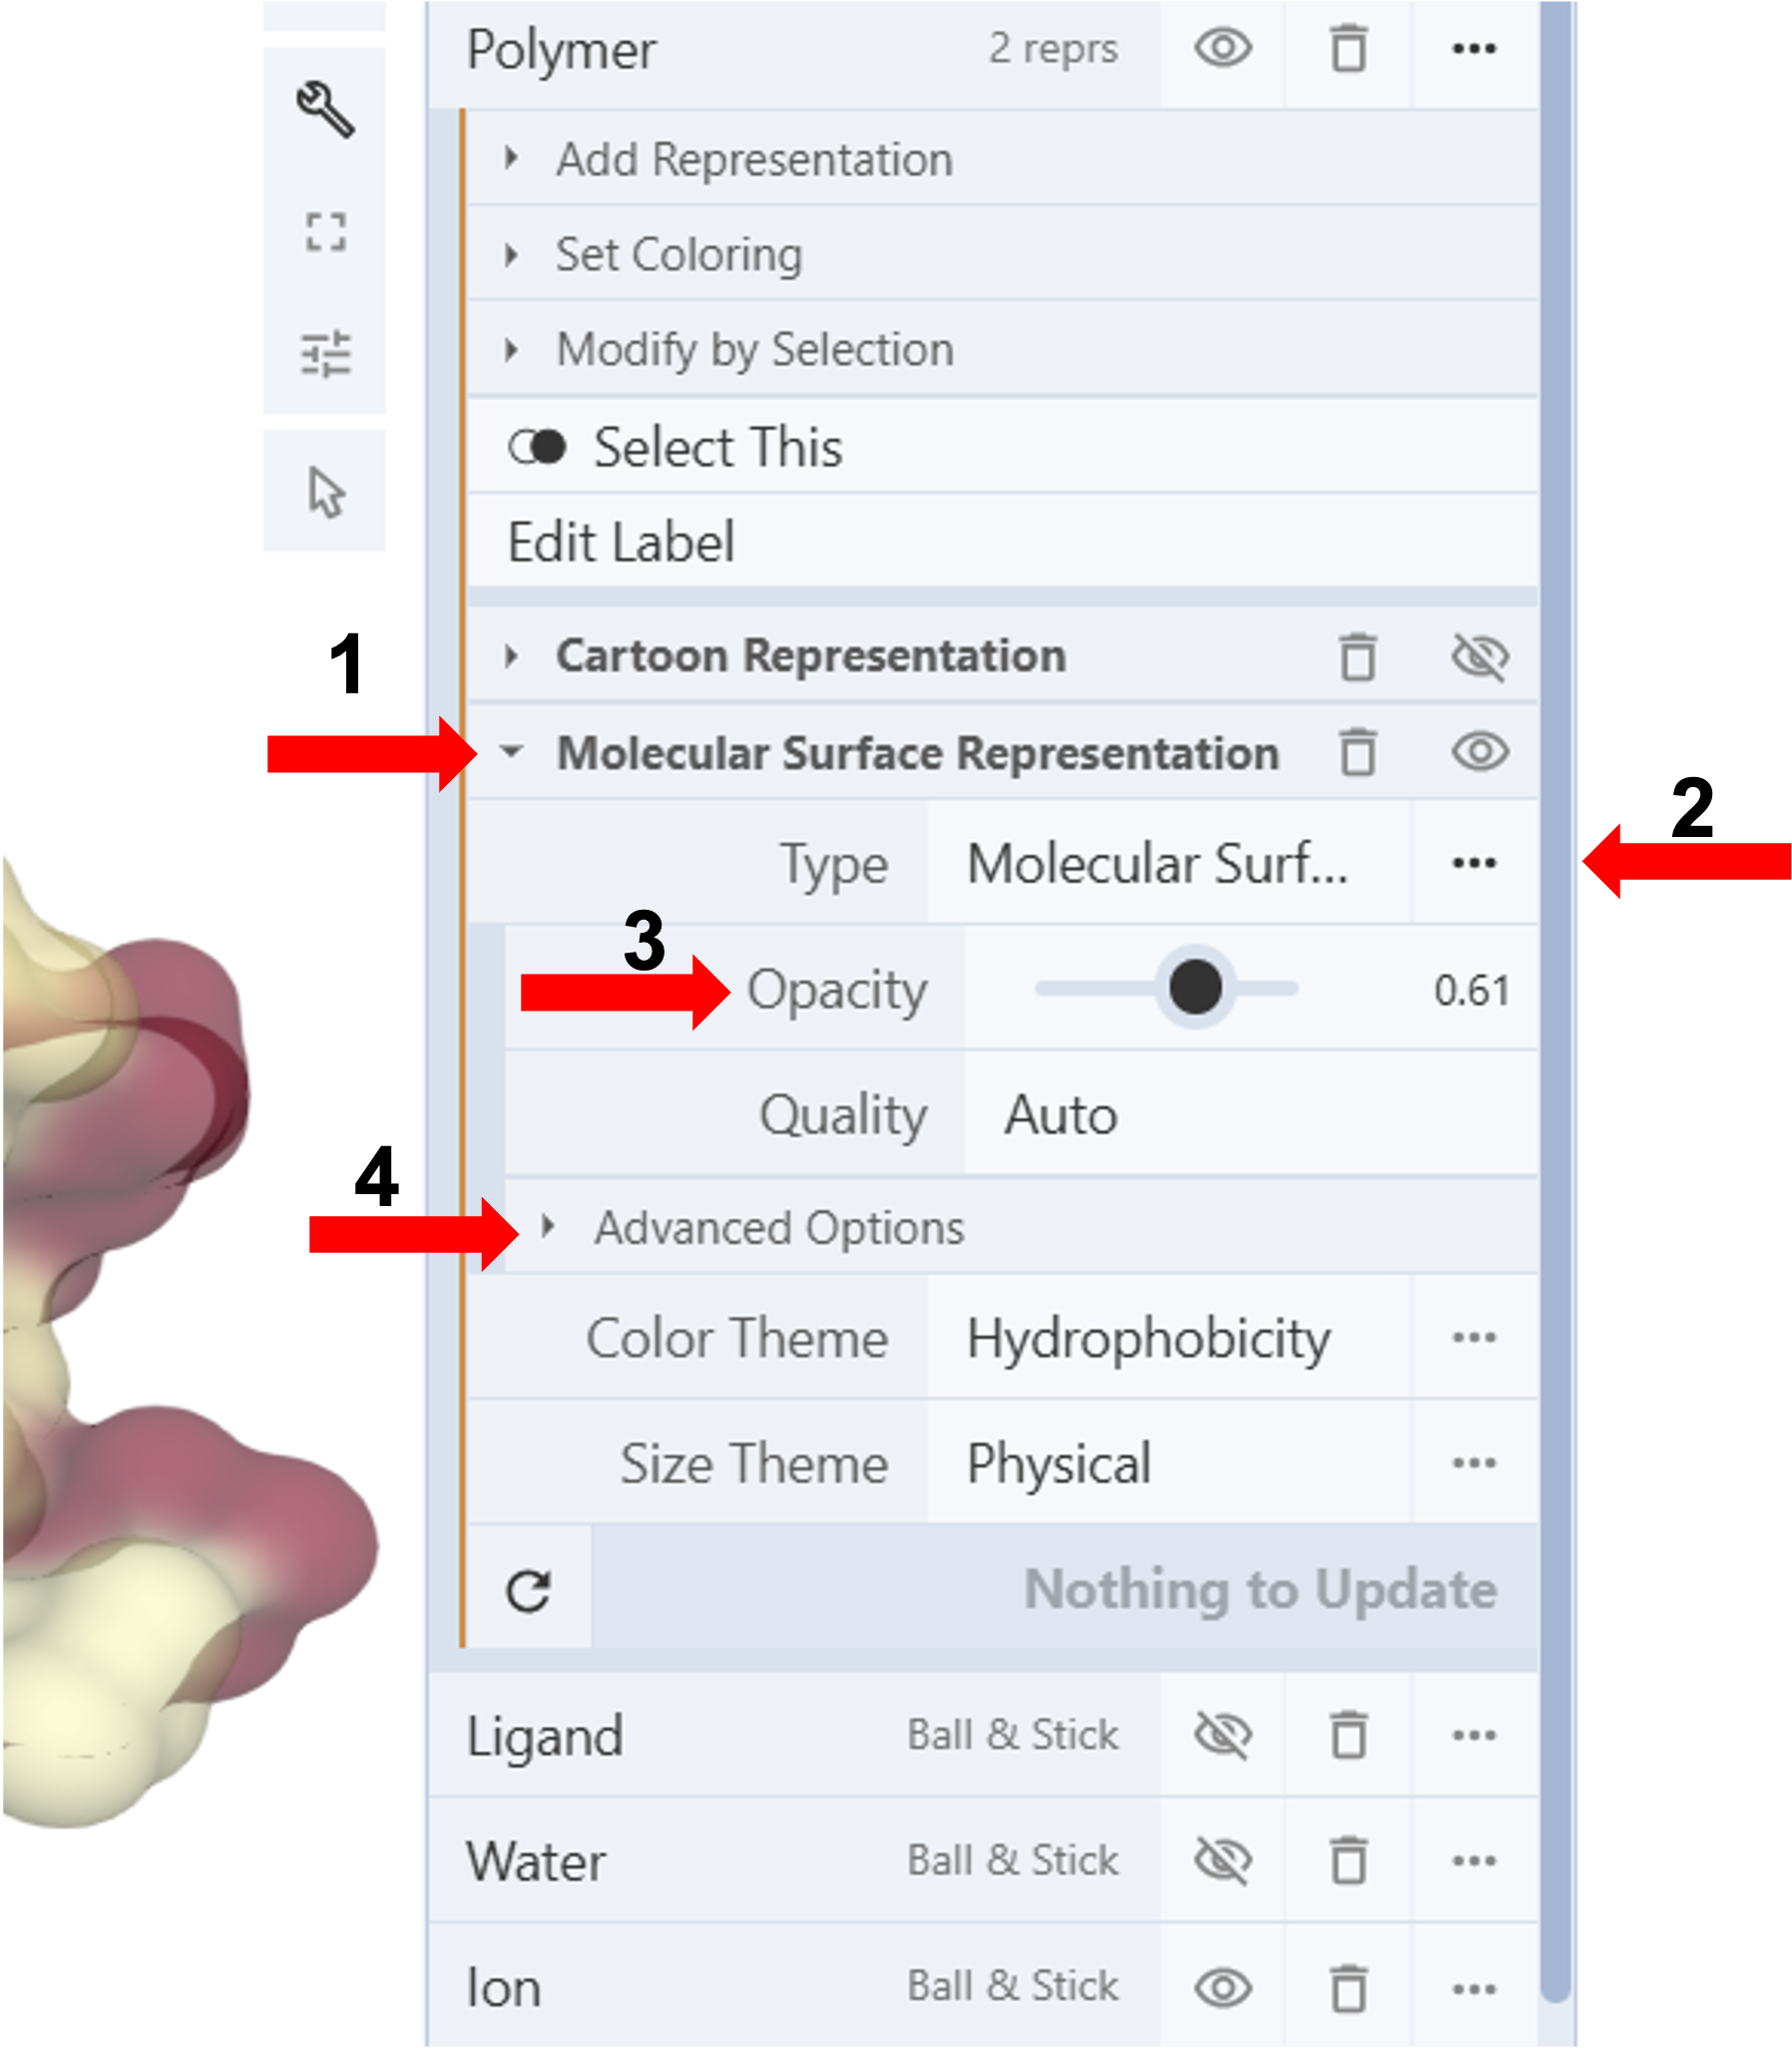
Change the Transparency of the Molecular Surface (Figure 5)
-
-
-
-
-
-
-
-
- Click “Molecular Surface Representation” to activate additional controls (Arrow 1).
- Click on the three dots to the right of “Type” to expand the menu (Arrow 2).
- Use the slider bar to adjust the “Opacity” (E.g., 0.5)(Arrow 3)
- Collapse the dropdown menu by re-clicking “Molecular Surface Representation” (Arrow 1)
-
-
-
-
-
-
-
Note: You can access additional controls for adjusting the molecular surface’s appearance by clicking “Advanced Options.” (Figure 4, Arrow 1). E.g., increasing the “radius” to 2 will result in a smoother surface appearance.
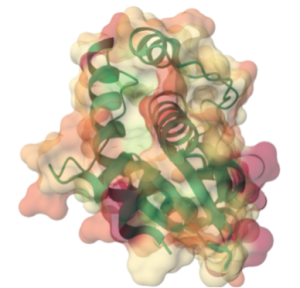
Overlay the Molecular Surface on a Different Representation (Figure 7)
Show an overlay of multiple representations (E.g., A semitransparent surface colored by hydrophobicity overlaid on a cartoon representation colored by chain id)
-
-
-
-
-
-
-
-
- Add desired representations
- Color each representation
- Adjust the transparency of each representation
- Use the “eye icon” to show all the desired representations as an overlay.
-
-
-
-
-
-
-
Jump to the next Mol* tutorial: IV.C. Biological vs. Asymmetric Units