
III.A. ChimeraX Molecular Surface/Properties
Walter Novak and Josh Beckham
Overview: This chapter describes the application of coloring to help display molecular properties.
Outcome: The user will be able to display the molecular surface of a structure, apply a chemical property-based coloring scheme, and change transparency.
Time to complete: 10 minutes
Modeling Skills
- Display the Molecular Surface of Protein
- Molecular with different colors
- Electrostatic Potential
- Hydrophobicity
About the Model
PDB ID: 1XWW
Protein: Low molecular weight protein tyrosine phosphatase
Activity: hydrolyzes Tyr-OPO32- phosphoester bond
Description: single chain, bound SO42- competitive inhibitor, bound glycerol (nonspecific stabilizer)
Steps
Load the Structure
- In the command line type: open 1XWW
Generate Molecular Surfaces and Surface Transparency
- In the pulldown menu, click “Actions” → Surface → Show.
- You may change the color of the surface independently. In the “Color Actions” panel (Actions → Color → All Options), ensure only “Surfaces” is checked in the “Coloring applies to:” section. Click on a color of your choice (Figure 1).
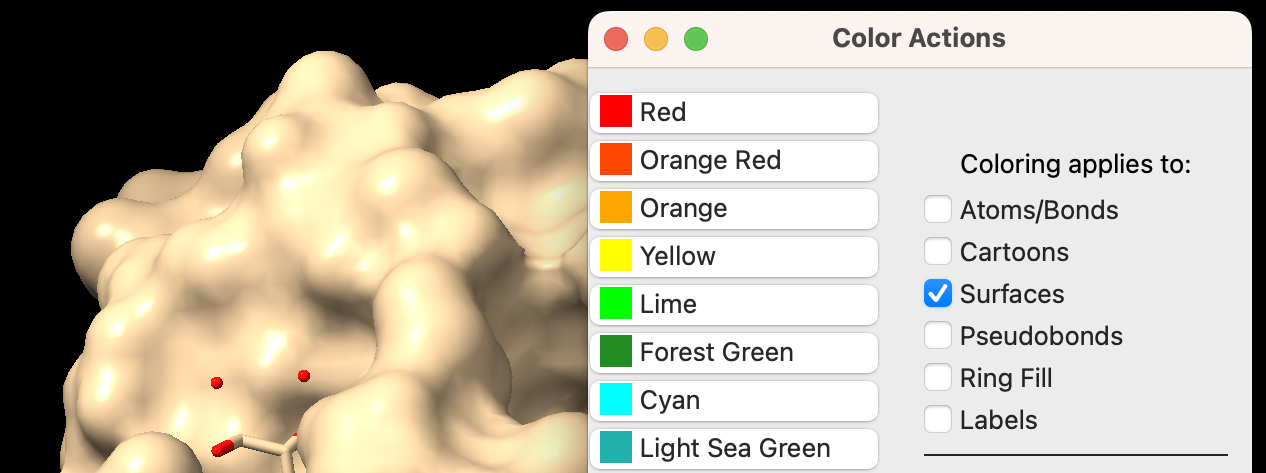
-
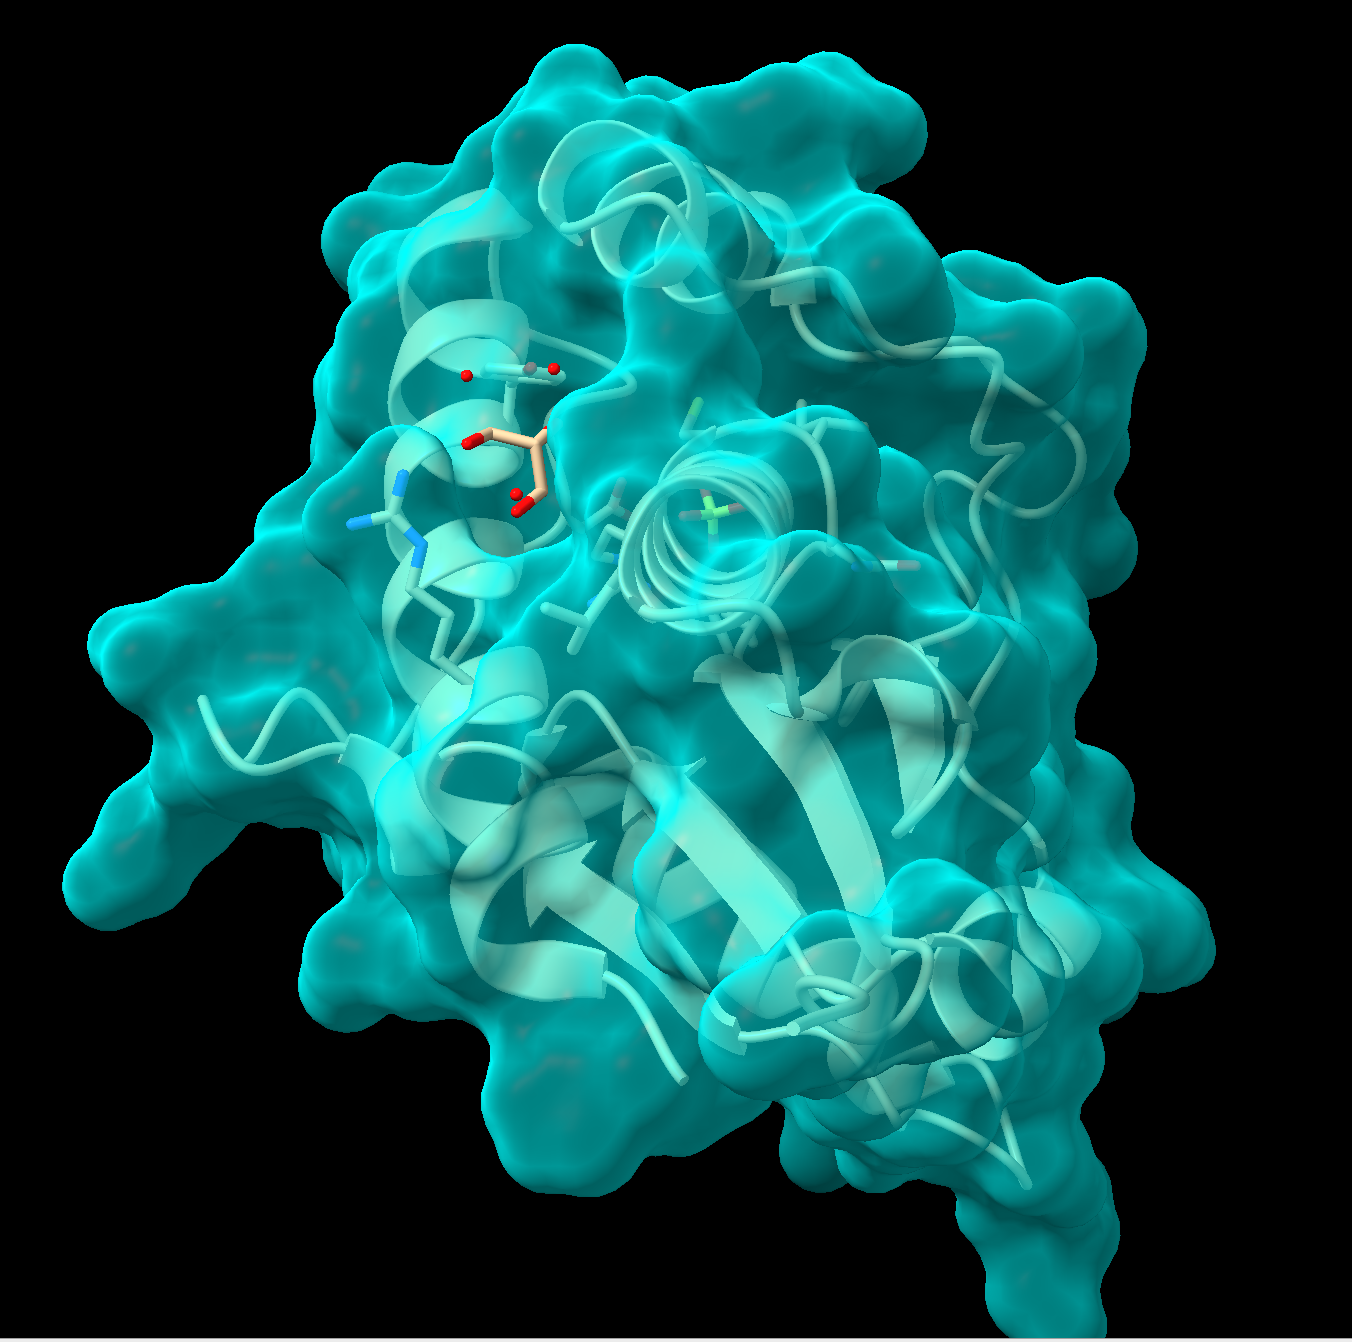
Figure 2: Step 4 output To make the surface semitransparent, in the command line type: transparency #1 50, where “#1” is the model ID and “50” is 50% transparent. Alternatively, using the pulldown menu: Actions → Surface → Transparency → 50%. See Figure 2 for an example output.
Generate an Electrostatic Potential Surface
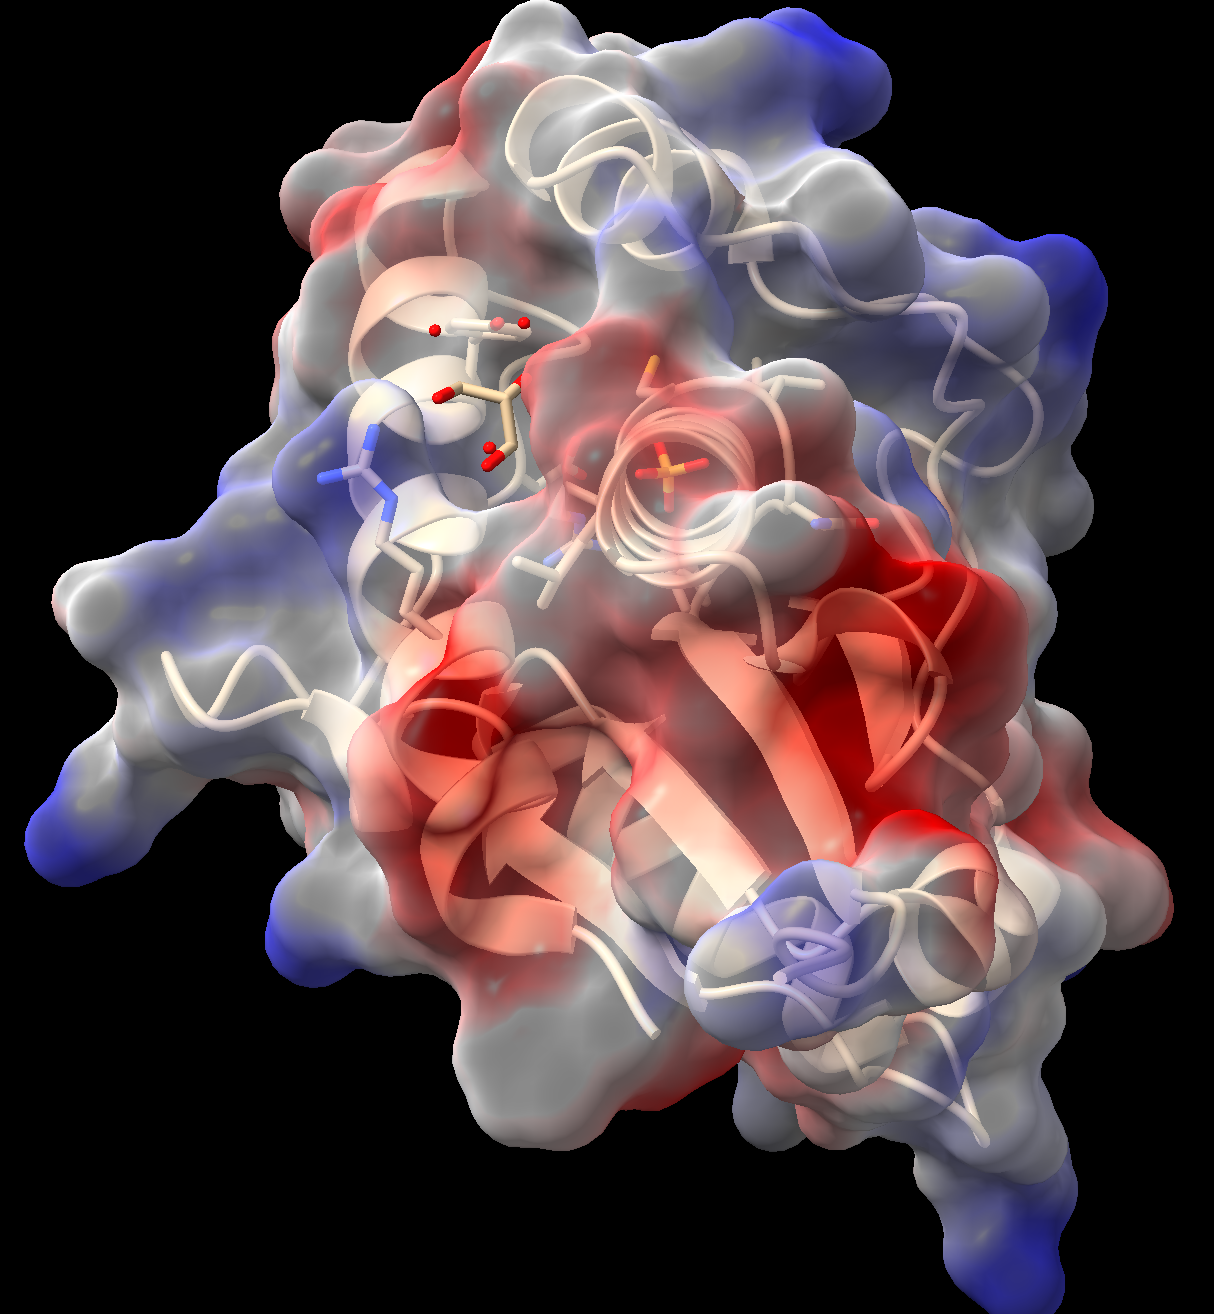
- In the “Molecule Display” toolbar, click the “electrostatic” button.
- ChimeraX will calculate the Coulombic potential and color the surface according to the calculated charge. Red = negative, white = neutral, blue = positive.
- As above, this surface may be made semitransparent (Figure 3). (Tip: use the up arrow on your keyboard while in the command line to recall prior commands.)
Generate a Hydrophobicity Surface
- In the “Molecular Display” toolbar, click the “hydrophobic” button.
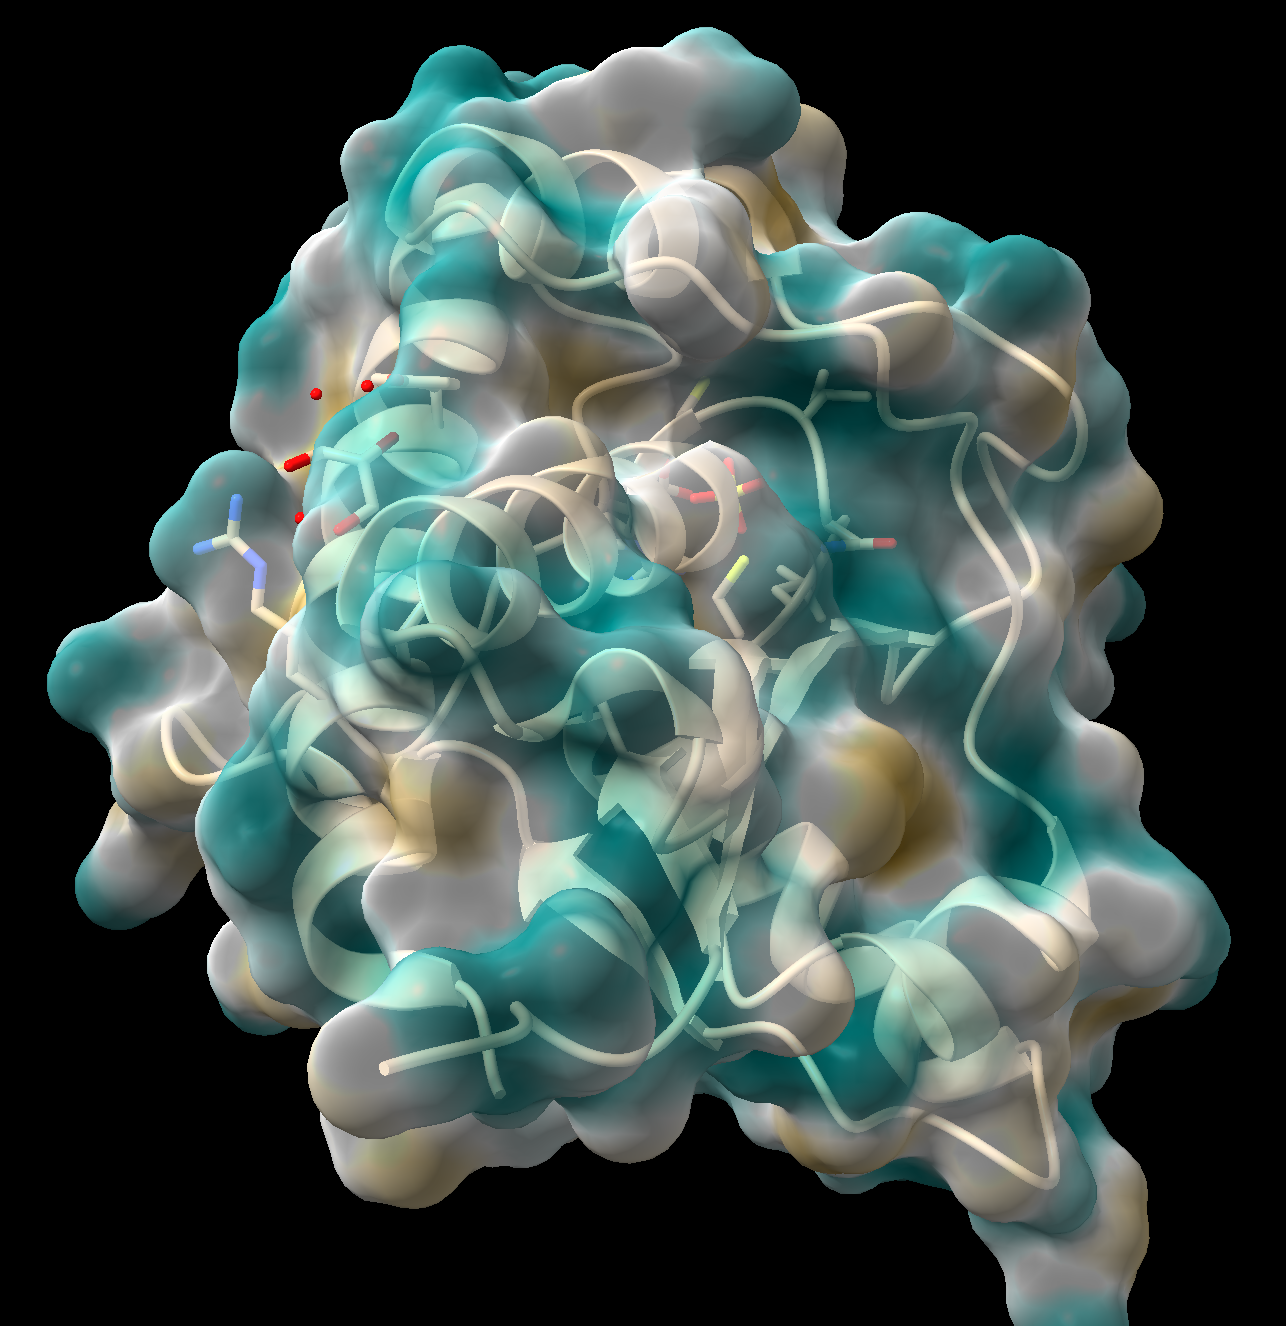
Figure 4: Step 10 output - ChimeraX will calculate the lipophilicity and color the surface. Dark goldenrod = more lipophilic (more hydrophobic), teal = less lipophilic (more hydrophilic).
- As above, this surface may be made semitransparent (Figure 4).
- (Optional) Save and close the session.
Note: You can show and hide any of the automatically rendered parts of the structure using the show/hide toolbars if you’d like to view the structure without ligands/secondary structure.
Jump to the next ChimeraX tutorial: IV.A. ChimeraX Viewing Biological vs. Asymmetric Units.